

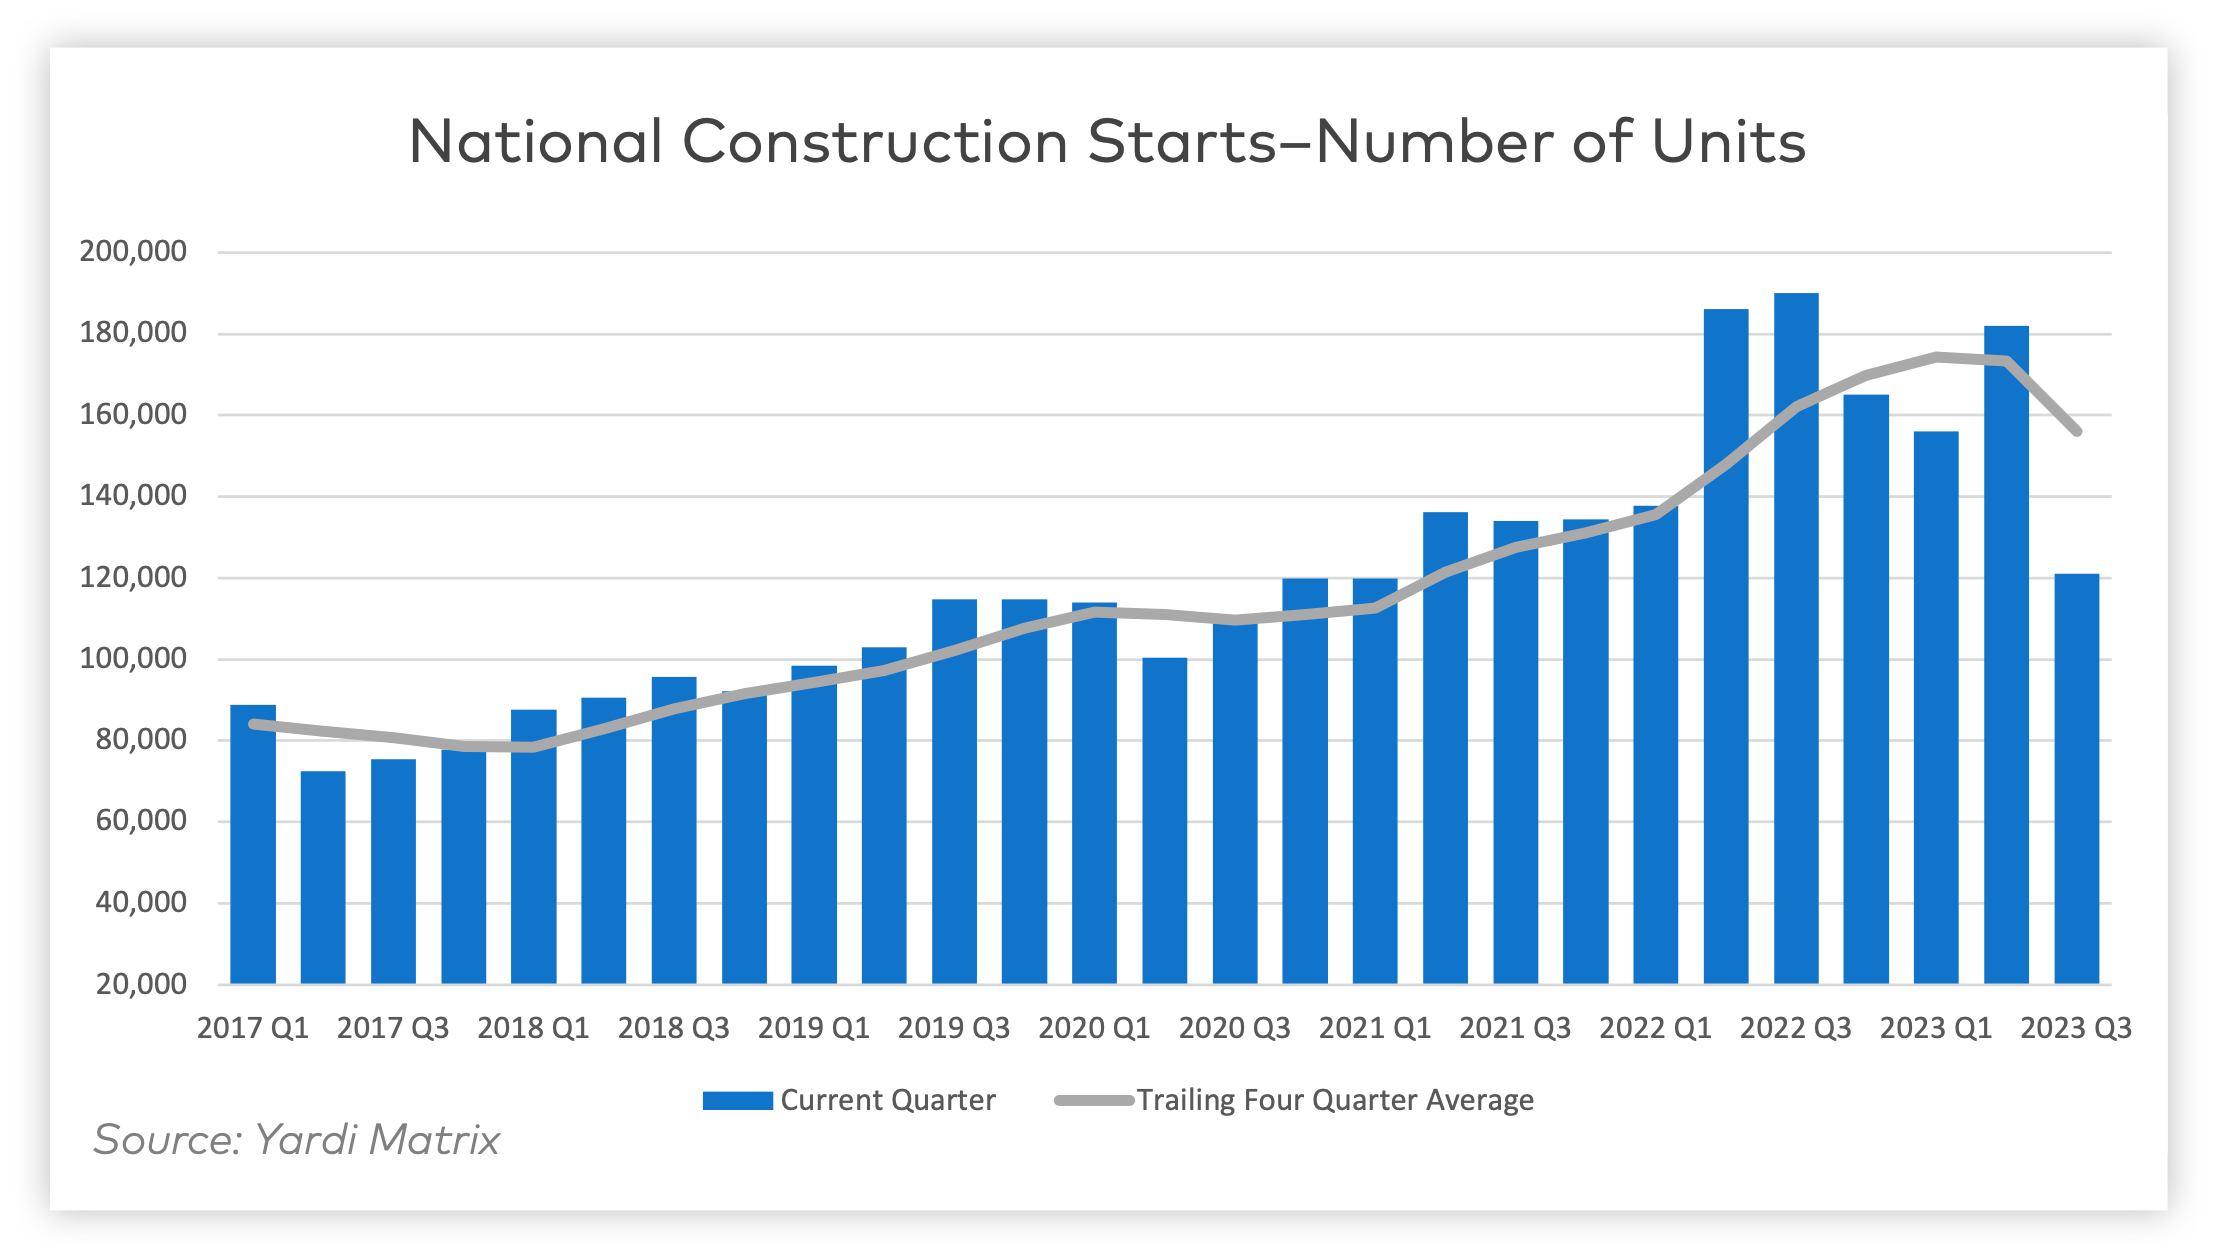
Despite a problematic financing environment, 2023 multifamily construction starts held up “remarkably well” according to the latest Yardi Matrix report. The data from 2023—albeit incomplete—shows that 506,742 units began construction. This figure ranks third for new construction starts even without the complete full year's data.
Yardi’s biggest takeaway is that multifamily development in 2023 exceeded initial expectations. This was driven in part by a “stronger-than-expected” Q1 and Q2, as well as an influx of affordable and single-family rental housing.
New Multifamily Development Insights
These are three insights from the Yardi Matrix Multifamily Construction Starts – January 2024 report:
1. Single-family rentals and affordable housing have become increasingly popular
For the last decade, the percentage of market rate multifamily units has declined in favor of other product types. While market rate units comprised 86% of all new multifamily construction starts in 2013, they now make up only 77% of the sector as of last year.
Conversely, affordable housing starts jumped from 8.4% to 13.4% of the total in ten years. Single-family rental increased from 0.9% to 5.8% in the same timeframe.
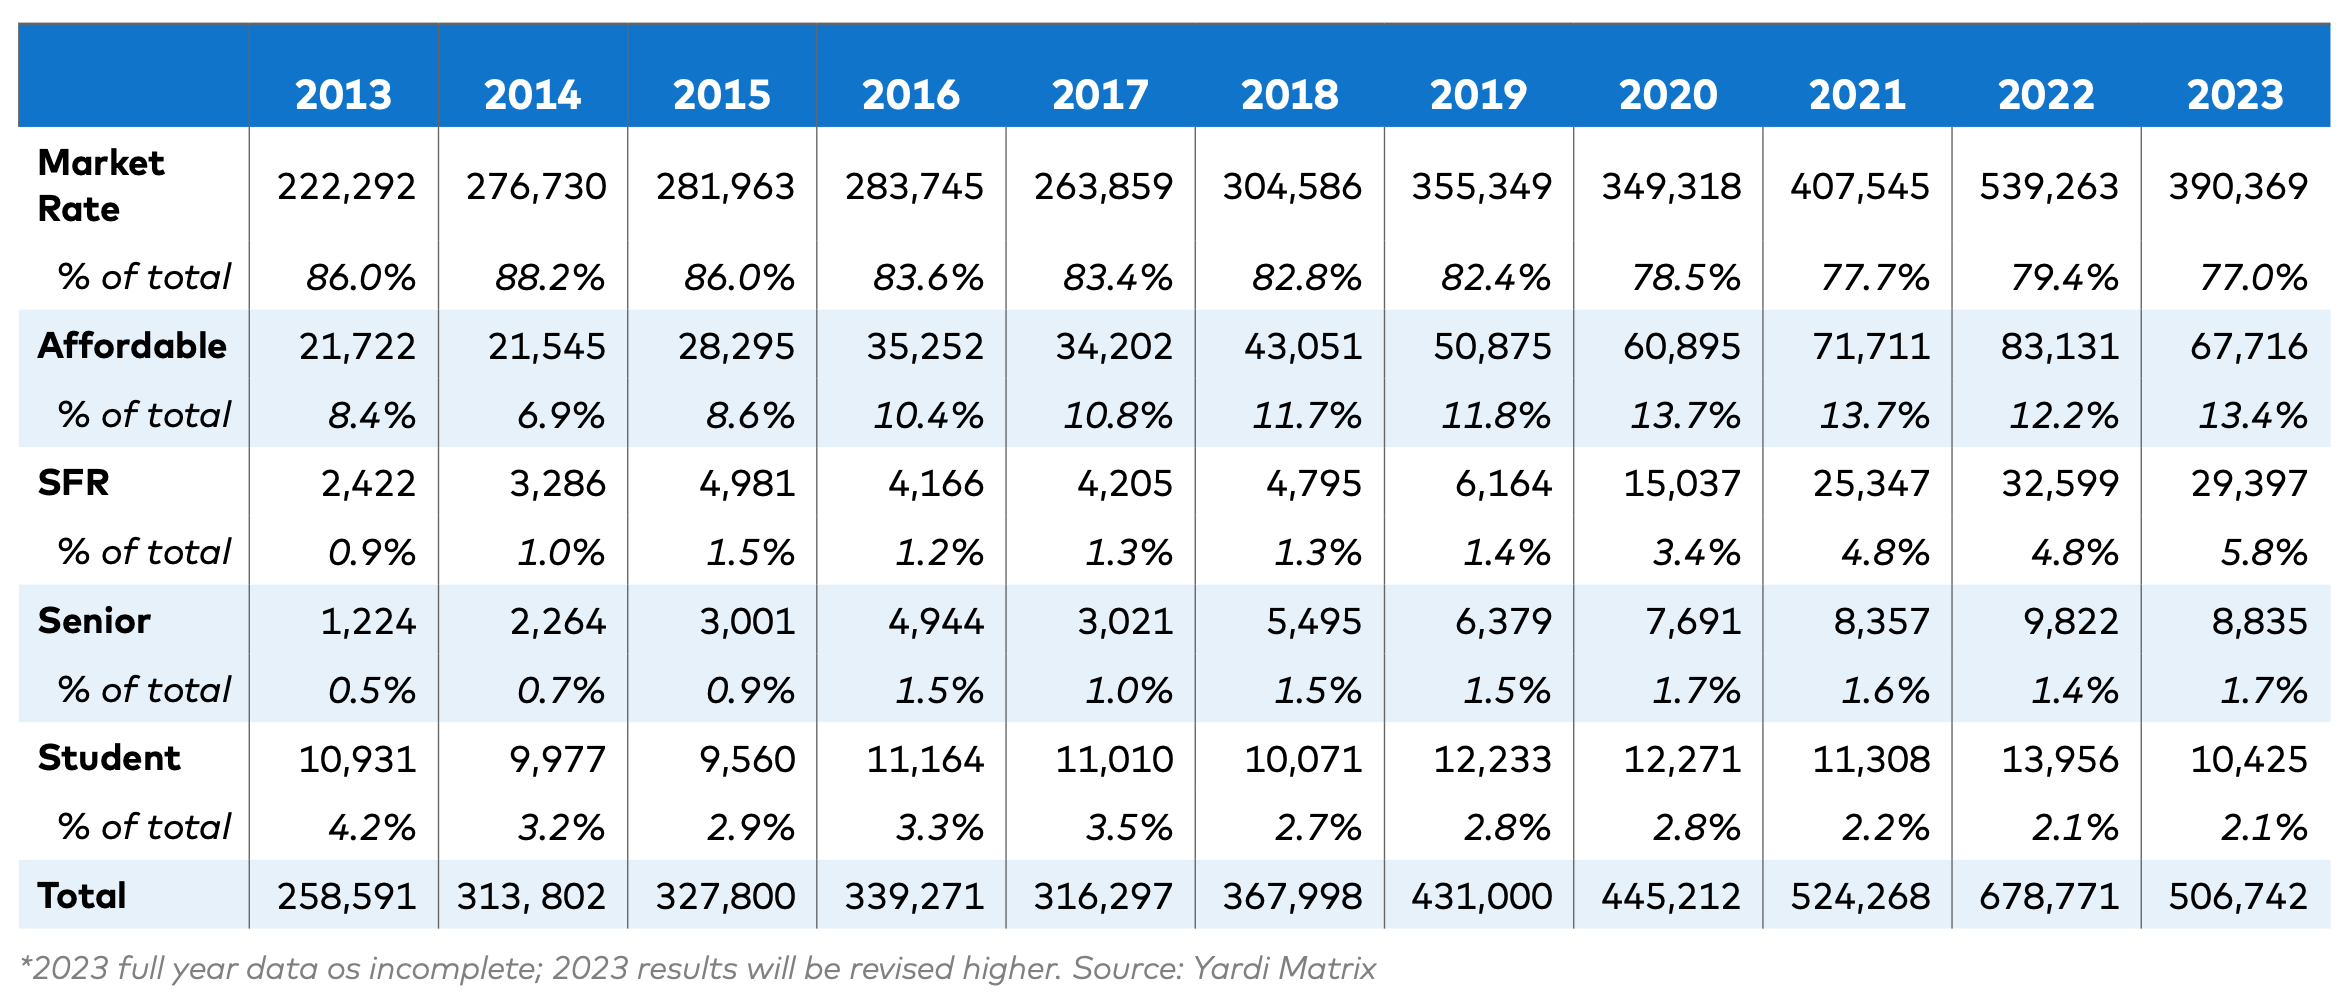
Senior housing has remained largely unchanged since 2013, increasing from 0.5% to 1.7%; student housing has been declining slowly, comprising 4.2% of multifamily construction starts in 2013 to 2.1% in 2023.
2. Markets with high levels of development in 2022 saw substantial declines in new construction starts in 2023
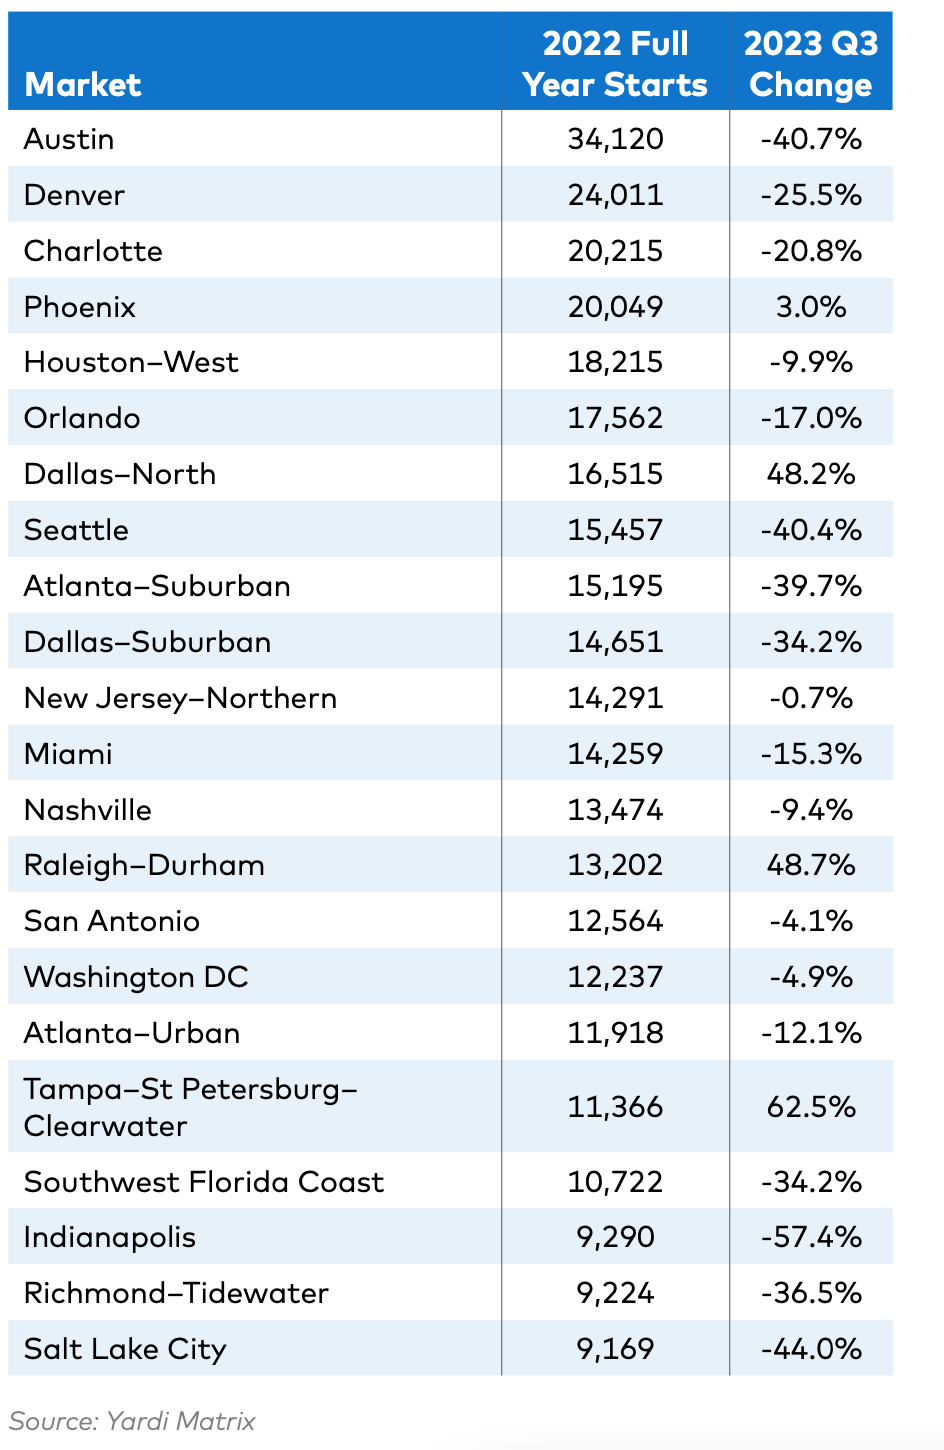
2022 saw 678,771 units start construction, a 29.4% increase over 2021 levels. Half of those were contained in just 22 markets. For the first three quarters of 2023, 18 of those markets saw starts decline compared to the same period in 2022.
Some of the more sizable declines in major metropolitan areas include:
- Salt Lake City, Utah, had a –44% change in multifamily starts from 2022
- Austin, Texas, had a –40.7% change in multifamily starts from 2022
- Seattle, Wash., had a –40.4% change in multifamily starts from 2022
Other markets like Southwest Florida Coast and suburban Atlanta, Dallas, and Denver saw starts decline by 25% or more.
3. Much of 2023’s new-development activity was driven by smaller and midsize markets
 According to the report, markets that did not participate in the post-pandemic development surge were better able to sustain new construction in 2023. These markets tended to be on the smaller size, averaging an increase of 2,161 units over the year.
Just four of the 22 strongest markets in 2022 continued to grow in 2023:
- Phoenix, Ariz., had a 3% growth in multifamily starts
- North Dallas, Texas, had a 48.2% growth in multifamily starts
- Raleigh–Durham, N.C., had a 48.7% growth in multifamily starts
- Tampa–St. Petersburg–Clearwater, Fla., had a 62.5% growth in multifamily starts
Other markets like Boston, Mass., (35%) and Kansas City, Mo., (41%) saw growth as well.
Bottom Line
Though slightly less than expected, new multifamily starts in 2023 are the 3rd highest year ever with 506,742 units. The growth primarily comes from affordable housing, single-family rentals, and smaller/midsize markets.
The decline this year is largely driven by tight financing conditions, and markets with high 2022 activity not being able to keep up. Despite the decline in starts, completions are expected to stay strong in 2024-2025.
Related Stories

Market Data | Sep 21, 2017
How brand research delivers competitive advantage
Brand research is a process that firms can use to measure their reputation and visibility in the marketplace.

Contractors | Sep 19, 2017
Commercial Construction Index finds high optimism in U.S. commercial construction industry
Hurricane recovery efforts expected to heighten concerns about labor scarcities in the south, where two-thirds of contractors already face worker shortages.

Multifamily Housing | Sep 15, 2017
Hurricane Harvey damaged fewer apartments in greater Houston than estimated
As of Sept. 14, 166 properties reported damage to 8,956 units, about 1.4% of the total supply of apartments, according to ApartmentData.com.

High-rise Construction | Sep 8, 2017
CTBUH determines fastest elevators and longest runs in the world in new TBIN Study
When it comes to the tallest skyscrapers in the world, the vertical commute in the building becomes just as important as the horizontal commute through the city.

Multifamily Housing | Sep 5, 2017
Free WiFi, meeting rooms most popular business services amenities in multifamily developments
Complimentary, building-wide WiFi is more or less a given for marketing purposes in the multifamily arena.

Market Data | Sep 5, 2017
Nonresidential construction declines again, public and private sector down in July
Weakness in spending was widespread.

Market Data | Aug 29, 2017
Hidden opportunities emerge from construction industry challenges
JLL’s latest construction report shows stability ahead with tech and innovation leading the way.

Architects | Aug 21, 2017
AIA: Architectural salaries exceed gains in the broader economy
AIA’s latest compensation report finds average compensation for staff positions up 2.8% from early 2015.
Market Data | Aug 17, 2017
Marcum Commercial Construction Index reports second quarter spending increase in commercial and office construction
Spending in all 12 of the remaining nonresidential construction subsectors retreated on both an annualized and monthly basis.

Industry Research | Aug 11, 2017
NCARB releases latest data on architectural education, licensure, and diversity
On average, becoming an architect takes 12.5 years—from the time a student enrolls in school to the moment they receive a license.


