


According to the common measure of housing affordability, a household is considered "cost-burdened" when housing expenses consume over 30% of occupant's total gross income. Those that spend more than 50% of their income on monthly housing costs are classified as "severely" cost-burdened.
The most recent data derived from the 2022 Census American Community Survey reveals that the proportion of American renters facing housing cost burdens has reached its highest point since 2012, undoing the progress made in the ten years leading up to the pandemic. The majority of this increase can be attributed to a surge in severely burdened households—those expending more than half of their earnings on rent.
The latest report by Apartment List explores the cost burden rate and what it says about the state of housing affordability in the U.S. Here are some of their takeaways:
1. The pandemic burdened nearly 2 million renters in the last three years
The number of cost-burdened renter households have been decreasing steadily since 2011. In a five-year span alone, the number of homes fell by 826,000 between 2014 and 2019. By 2019, just under 20 million renter households were considered cost-burdened.
In 2022, however, the number of cost-burdened renter households has increased by 1.9 million—making the total 21.8 million—and the number of non-burdened households fell by 957,000.

2. Severely-burdened households make up 27% of those affected
Renter households that spend more that 50% of their income on housing costs are considered severely-burdened. In the past three years, the share of these households among the total of those burdened increased by 3% to 26.7 percent.
Though the cost burden rate is much lower for those who own homes, it has also been rising in recent years. In 2022, the percentage of homeowners that are cost-burdened jumped to 27.9 percent, up from 26.6% in 2019.

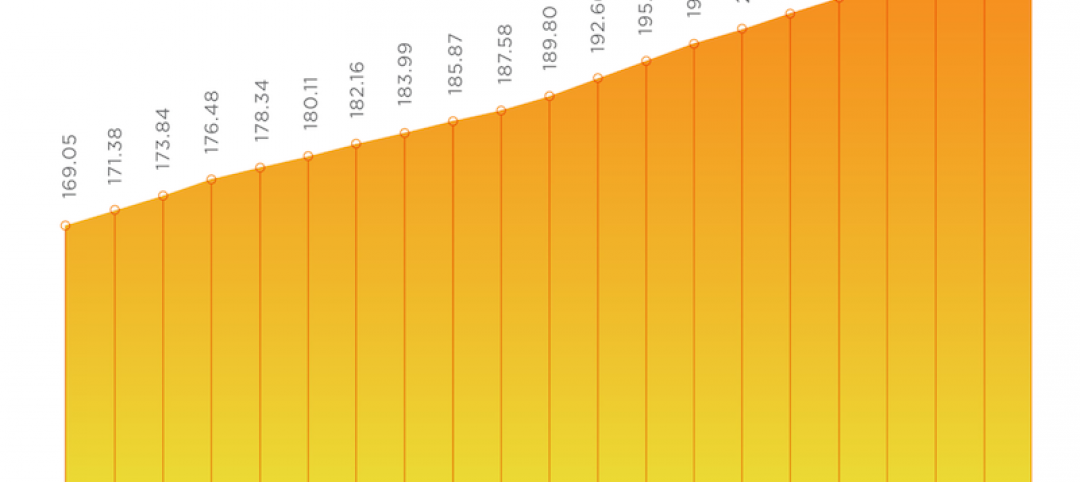
3. The cost burden is driven by rent prices rising faster than household incomes
After the Great Recession, renter cost burden improved gradually for several years. While the median rent rose 26 percent, the median renter household income increased 37 percent in the same eight years.
Since 2019, renter cost burden has increased 4% and median rent jumped up 19 percent, while renter income rose only 16 percent. According to the Apartment List analysis, 74 of the 100 largest U.S. metros have experienced rent prices growing faster than renter income. Since 2019, the cost burden has worsened in nearly all (94%) of the top metros.

Future outlook from Apartment List
"Preliminary data from the Bureau of Labor Statistics shows that incomes in the second quarter of 2023 are up 5.7% year-over-year (1.7% after adjusting for inflation). And while these statistics are not available for renters specifically, other breakdowns show that recent wage growth is higher for lower-earners and non-white workers, who are both more likely to rent.
However, rent growth may also continue on an upward trajectory. For more than half of all renter households, monthly rent payments are eating up a large enough share of their income to put financial stability at risk. And more than one-in-four renter households spend more than half of their income on rent—a level which can often necessitate extreme measures such as overcrowding and cutting back on spending on other basic needs. Thankfully, policymakers have demonstrated an increased focus on this issue in recent years, but solutions are still urgently needed."
To read the full report, visit Apartment List
Related Stories

Market Data | Jan 19, 2021
2021 construction forecast: Nonresidential building spending will drop 5.7%, bounce back in 2022
Healthcare and public safety are the only nonresidential construction sectors that will see growth in spending in 2021, according to AIA's 2021 Consensus Construction Forecast.

Market Data | Jan 13, 2021
Atlanta, Dallas seen as most favorable U.S. markets for commercial development in 2021, CBRE analysis finds
U.S. construction activity is expected to bounce back in 2021, after a slowdown in 2020 due to challenges brought by COVID-19.
Market Data | Jan 13, 2021
Nonres construction could be in for a long recovery period
Rider Levett Bucknall’s latest cost report singles out unemployment and infrastructure spending as barometers.

Market Data | Jan 13, 2021
Contractor optimism improves as ABC’s Construction Backlog inches up in December
ABC’s Construction Confidence Index readings for sales, profit margins, and staffing levels increased in December.

Market Data | Jan 11, 2021
Turner Construction Company launches SourceBlue Brand
SourceBlue draws upon 20 years of supply chain management experience in the construction industry.

Market Data | Jan 8, 2021
Construction sector adds 51,000 jobs in December
Gains are likely temporary as new industry survey finds widespread pessimism for 2021.

Market Data | Jan 7, 2021
Few construction firms will add workers in 2021 as industry struggles with declining demand, growing number of project delays and cancellations
New industry outlook finds most contractors expect demand for many categories of construction to decline.

Market Data | Jan 5, 2021
Barely one-third of metros add construction jobs in latest 12 months
Dwindling list of project starts forces contractors to lay off workers.

Market Data | Jan 4, 2021
Nonresidential construction spending shrinks further in November
Many commercial projects languish, even while homebuilding soars.

Market Data | Dec 29, 2020
Multifamily transactions drop sharply in 2020, according to special report from Yardi Matrix
Sales completions at end of Q3 were down over 41 percent from the same period a year ago.


