


According to the common measure of housing affordability, a household is considered "cost-burdened" when housing expenses consume over 30% of occupant's total gross income. Those that spend more than 50% of their income on monthly housing costs are classified as "severely" cost-burdened.
The most recent data derived from the 2022 Census American Community Survey reveals that the proportion of American renters facing housing cost burdens has reached its highest point since 2012, undoing the progress made in the ten years leading up to the pandemic. The majority of this increase can be attributed to a surge in severely burdened households—those expending more than half of their earnings on rent.
The latest report by Apartment List explores the cost burden rate and what it says about the state of housing affordability in the U.S. Here are some of their takeaways:
1. The pandemic burdened nearly 2 million renters in the last three years
The number of cost-burdened renter households have been decreasing steadily since 2011. In a five-year span alone, the number of homes fell by 826,000 between 2014 and 2019. By 2019, just under 20 million renter households were considered cost-burdened.
In 2022, however, the number of cost-burdened renter households has increased by 1.9 million—making the total 21.8 million—and the number of non-burdened households fell by 957,000.

2. Severely-burdened households make up 27% of those affected
Renter households that spend more that 50% of their income on housing costs are considered severely-burdened. In the past three years, the share of these households among the total of those burdened increased by 3% to 26.7 percent.
Though the cost burden rate is much lower for those who own homes, it has also been rising in recent years. In 2022, the percentage of homeowners that are cost-burdened jumped to 27.9 percent, up from 26.6% in 2019.

3. The cost burden is driven by rent prices rising faster than household incomes
After the Great Recession, renter cost burden improved gradually for several years. While the median rent rose 26 percent, the median renter household income increased 37 percent in the same eight years.
Since 2019, renter cost burden has increased 4% and median rent jumped up 19 percent, while renter income rose only 16 percent. According to the Apartment List analysis, 74 of the 100 largest U.S. metros have experienced rent prices growing faster than renter income. Since 2019, the cost burden has worsened in nearly all (94%) of the top metros.

Future outlook from Apartment List
"Preliminary data from the Bureau of Labor Statistics shows that incomes in the second quarter of 2023 are up 5.7% year-over-year (1.7% after adjusting for inflation). And while these statistics are not available for renters specifically, other breakdowns show that recent wage growth is higher for lower-earners and non-white workers, who are both more likely to rent.
However, rent growth may also continue on an upward trajectory. For more than half of all renter households, monthly rent payments are eating up a large enough share of their income to put financial stability at risk. And more than one-in-four renter households spend more than half of their income on rent—a level which can often necessitate extreme measures such as overcrowding and cutting back on spending on other basic needs. Thankfully, policymakers have demonstrated an increased focus on this issue in recent years, but solutions are still urgently needed."
To read the full report, visit Apartment List
Related Stories
Market Data | Apr 29, 2022
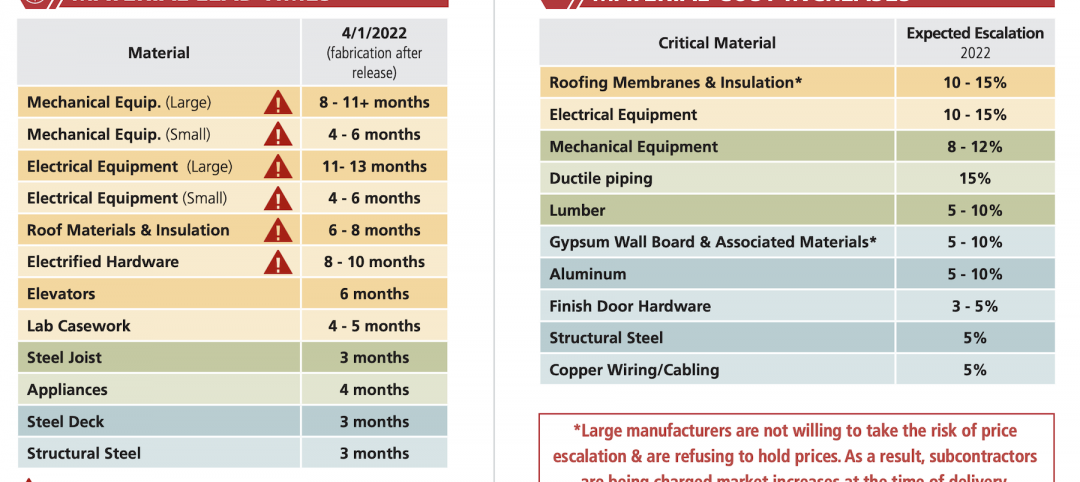
Global forces push construction prices higher
Consigli’s latest forecast predicts high single-digit increases for this year.

Market Data | Apr 29, 2022
U.S. economy contracts, investment in structures down, says ABC
The U.S. economy contracted at a 1.4% annualized rate during the first quarter of 2022.

Market Data | Apr 20, 2022
Pace of demand for design services rapidly accelerates
Demand for design services in March expanded sharply from February according to a new report today from The American Institute of Architects (AIA).

Market Data | Apr 14, 2022
FMI 2022 construction spending forecast: 7% growth despite economic turmoil
Growth will be offset by inflation, supply chain snarls, a shortage of workers, project delays, and economic turmoil caused by international events such as the Russia-Ukraine war.
Industrial Facilities | Apr 14, 2022
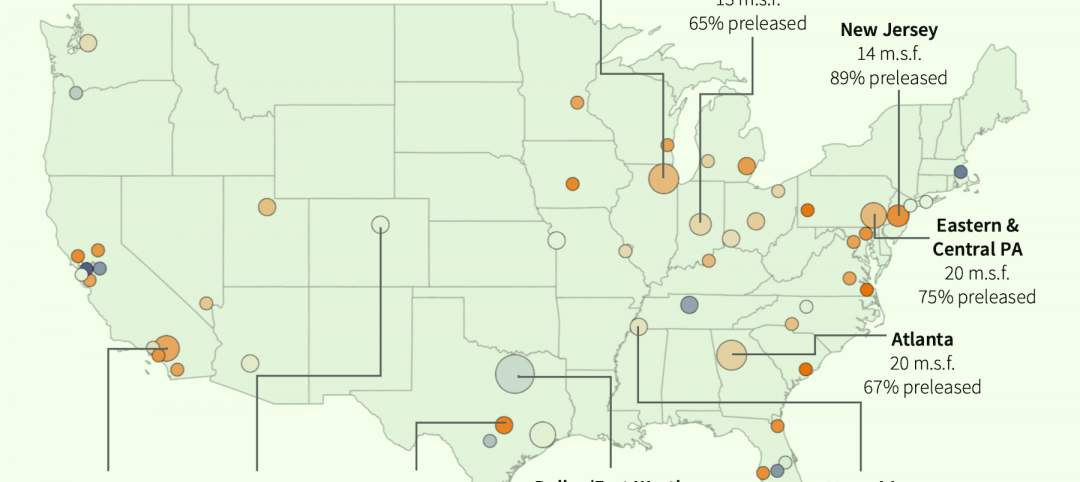
JLL's take on the race for industrial space
In the previous decade, the inventory of industrial space couldn’t keep up with demand that was driven by the dual surges of the coronavirus and online shopping. Vacancies declined and rents rose. JLL has just published a research report on this sector called “The Race for Industrial Space.” Mehtab Randhawa, JLL’s Americas Head of Industrial Research, shares the highlights of a new report on the industrial sector's growth.

Codes and Standards | Apr 4, 2022
Construction of industrial space continues robust growth
Construction and development of new industrial space in the U.S. remains robust, with all signs pointing to another big year in this market segment

Reconstruction & Renovation | Mar 28, 2022
Is your firm a reconstruction sector giant?
Is your firm active in the U.S. building reconstruction, renovation, historic preservation, and adaptive reuse markets? We invite you to participate in BD+C's inaugural Reconstruction Market Research Report.

Industry Research | Mar 28, 2022
ABC Construction Backlog Indicator unchanged in February
Associated Builders and Contractors reported today that its Construction Backlog Indicator remained unchanged at 8.0 months in February, according to an ABC member survey conducted Feb. 21 to March 8.

Industry Research | Mar 23, 2022
Architecture Billings Index (ABI) shows the demand for design service continues to grow
Demand for design services in February grew slightly since January, according to a new report today from The American Institute of Architects (AIA).

Codes and Standards | Mar 1, 2022
Engineering Business Sentiment study finds optimism despite growing economic concerns
The ACEC Research Institute found widespread optimism among engineering firm executives in its second quarterly Engineering Business Sentiment study.


