

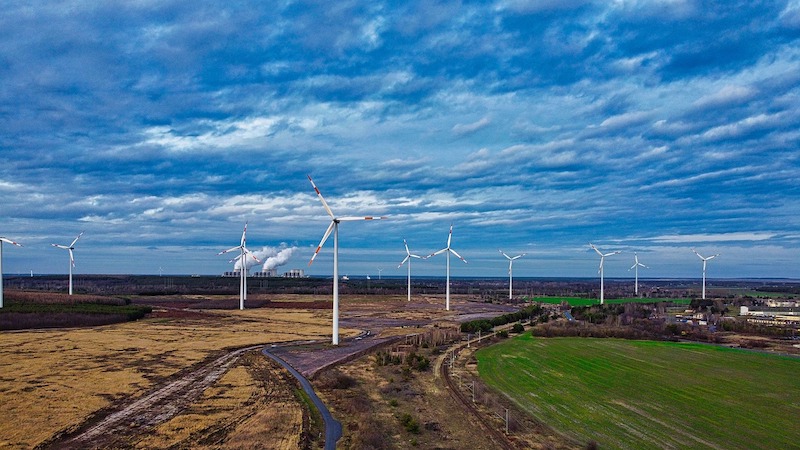
A new report from Navigant Research analyzes the global wind power market to assess current and future development cycles and projections for new installed wind capacity. The report provides global market forecasts, segmented by region, through 2028.
Global wind industry installations were flat from 2017 to 2018, but behind the flat figures are profound shifts throughout global wind power markets. Some mature markets are facing flat or declining growth due to adjustments to more competitive policy environments and reductions or eliminations of subsidies. However, these changes are being offset by increasing wind power development in countries that were not previously wind power markets. This new capacity represents a market worth more than $92 billion in 2019 and more than $1 trillion over the forecast decade.
“Growth in wind capacity is led by countries in Asia Pacific and non-traditional markets in Europe, Latin America, and the Middle East & Africa,” says Jesse Broehl, senior research analyst with Navigant Research. “Wind power is being developed not only in a greater variety of countries but also increasingly in offshore as well as onshore.”
According to the report, global offshore wind development is expected to experience a 16% compound annual growth rate over a 10-year forecast period. China, Taiwan, and Europe are the leading markets, with the US soon to join when the first large-scale offshore wind plants are commissioned in coming years along the northeast coast of the country. The report also examines the annual installed capacity of top global wind turbine original equipment manufacturers (OEMs) and related market share and ranking. The most recent year-end 2018 data shows Denmark-based Vestas retaking the global total annual capacity lead and three other Western OEMs falling in the global total annual rankings. The turbine OEM market dynamics show consolidation throughout the sector, with top OEMs commanding larger market shares.
The report, Global Wind Energy Overview, analyzes the global wind power market to assess current and future development cycles and projections for new installed wind capacity. The study provides an analysis of the market issues related to wind development, including drivers and barriers such as power contract auction rates, volume, and related policy and market environments. Global market forecasts, segmented by region, extend through 2028. The report also summarizes the key industry players related to wind power development. An Executive Summary of the report is available for free download on the Navigant Research website.
Related Stories

Industry Research | Jun 15, 2017
Commercial Construction Index indicates high revenue and employment expectations for 2017
USG Corporation (USG) and U.S. Chamber of Commerce release survey results gauging confidence among industry leaders.

Market Data | Jun 2, 2017
Nonresidential construction spending falls in 13 of 16 segments in April
Nonresidential construction spending fell 1.7% in April 2017, totaling $696.3 billion on a seasonally adjusted, annualized basis, according to analysis of U.S. Census Bureau data released today by Associated Builders and Contractors.

Industry Research | May 25, 2017
Project labor agreement mandates inflate cost of construction 13%
Ohio schools built under government-mandated project labor agreements (PLAs) cost 13.12 percent more than schools that were bid and constructed through fair and open competition.

Market Data | May 24, 2017
Design billings increasing entering height of construction season
All regions report positive business conditions.

Market Data | May 24, 2017
The top franchise companies in the construction pipeline
3 franchise companies comprise 65% of all rooms in the Total Pipeline.

Industry Research | May 24, 2017
These buildings paid the highest property taxes in 2016
Office buildings dominate the list, but a residential community climbed as high as number two on the list.

Market Data | May 16, 2017
Construction firms add 5,000 jobs in April
Unemployment down to 4.4%; Specialty trade jobs dip slightly.

Multifamily Housing | May 10, 2017
May 2017 National Apartment Report
Median one-bedroom rent rose to $1,012 in April, the highest it has been since January.

Senior Living Design | May 9, 2017
Designing for a future of limited mobility
There is an accessibility challenge facing the U.S. An estimated 1 in 5 people will be aged 65 or older by 2040.

Industry Research | May 4, 2017
How your AEC firm can go from the shortlist to winning new business
Here are four key lessons to help you close more business.


