

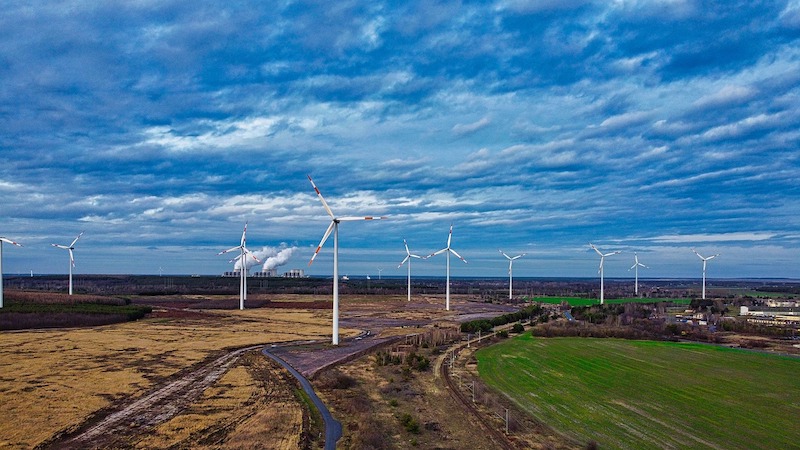
A new report from Navigant Research analyzes the global wind power market to assess current and future development cycles and projections for new installed wind capacity. The report provides global market forecasts, segmented by region, through 2028.
Global wind industry installations were flat from 2017 to 2018, but behind the flat figures are profound shifts throughout global wind power markets. Some mature markets are facing flat or declining growth due to adjustments to more competitive policy environments and reductions or eliminations of subsidies. However, these changes are being offset by increasing wind power development in countries that were not previously wind power markets. This new capacity represents a market worth more than $92 billion in 2019 and more than $1 trillion over the forecast decade.
“Growth in wind capacity is led by countries in Asia Pacific and non-traditional markets in Europe, Latin America, and the Middle East & Africa,” says Jesse Broehl, senior research analyst with Navigant Research. “Wind power is being developed not only in a greater variety of countries but also increasingly in offshore as well as onshore.”
According to the report, global offshore wind development is expected to experience a 16% compound annual growth rate over a 10-year forecast period. China, Taiwan, and Europe are the leading markets, with the US soon to join when the first large-scale offshore wind plants are commissioned in coming years along the northeast coast of the country. The report also examines the annual installed capacity of top global wind turbine original equipment manufacturers (OEMs) and related market share and ranking. The most recent year-end 2018 data shows Denmark-based Vestas retaking the global total annual capacity lead and three other Western OEMs falling in the global total annual rankings. The turbine OEM market dynamics show consolidation throughout the sector, with top OEMs commanding larger market shares.
The report, Global Wind Energy Overview, analyzes the global wind power market to assess current and future development cycles and projections for new installed wind capacity. The study provides an analysis of the market issues related to wind development, including drivers and barriers such as power contract auction rates, volume, and related policy and market environments. Global market forecasts, segmented by region, extend through 2028. The report also summarizes the key industry players related to wind power development. An Executive Summary of the report is available for free download on the Navigant Research website.
Related Stories

Market Data | Apr 29, 2019
U.S. economic growth crosses 3% threshold to begin the year
Growth was fueled by myriad factors, including personal consumption expenditures, private inventory investment, surprisingly rapid growth in exports, state and local government spending and intellectual property.

Market Data | Apr 18, 2019
ABC report: 'Confidence seems to be making a comeback in America'
The Construction Confidence Index remained strong in February, according to the Associated Builders and Contractors.

Market Data | Apr 16, 2019
ABC’s Construction Backlog Indicator rebounds in February
ABC's Construction Backlog Indicator expanded to 8.8 months in February 2019.

Market Data | Apr 8, 2019
Engineering, construction spending to rise 3% in 2019: FMI outlook
Top-performing segments forecast in 2019 include transportation, public safety, and education.

Market Data | Apr 1, 2019
Nonresidential spending expands again in February
Private nonresidential spending fell 0.5% for the month and is only up 0.1% on a year-over-year basis.

Market Data | Mar 22, 2019
Construction contractors regain confidence in January 2019
Expectations for sales during the coming six-month period remained especially upbeat in January.

Market Data | Mar 21, 2019
Billings moderate in February following robust New Year
AIA’s Architecture Billings Index (ABI) score for February was 50.3, down from 55.3 in January.

Market Data | Mar 19, 2019
ABC’s Construction Backlog Indicator declines sharply in January 2019
The Construction Backlog Indicator contracted to 8.1 months during January 2019.

Market Data | Mar 15, 2019
2019 starts off with expansion in nonresidential spending
At a seasonally adjusted annualized rate, nonresidential spending totaled $762.5 billion for the month.

Market Data | Mar 14, 2019
Construction input prices rise for first time since October
Of the 11 construction subcategories, seven experienced price declines for the month.


