

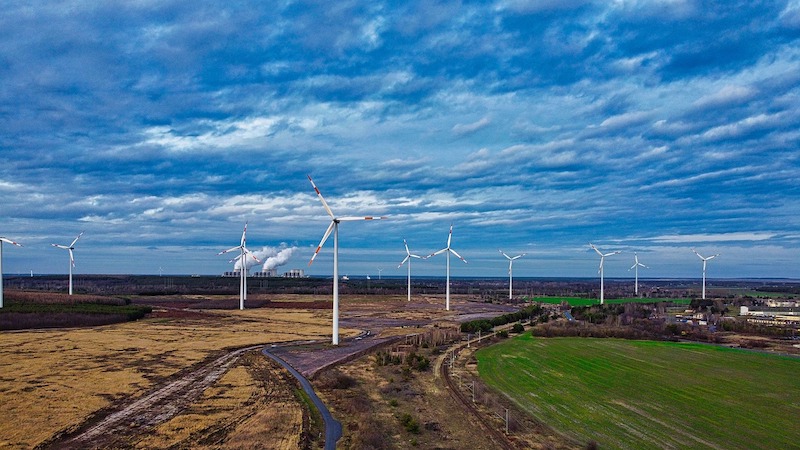
A new report from Navigant Research analyzes the global wind power market to assess current and future development cycles and projections for new installed wind capacity. The report provides global market forecasts, segmented by region, through 2028.
Global wind industry installations were flat from 2017 to 2018, but behind the flat figures are profound shifts throughout global wind power markets. Some mature markets are facing flat or declining growth due to adjustments to more competitive policy environments and reductions or eliminations of subsidies. However, these changes are being offset by increasing wind power development in countries that were not previously wind power markets. This new capacity represents a market worth more than $92 billion in 2019 and more than $1 trillion over the forecast decade.
“Growth in wind capacity is led by countries in Asia Pacific and non-traditional markets in Europe, Latin America, and the Middle East & Africa,” says Jesse Broehl, senior research analyst with Navigant Research. “Wind power is being developed not only in a greater variety of countries but also increasingly in offshore as well as onshore.”
According to the report, global offshore wind development is expected to experience a 16% compound annual growth rate over a 10-year forecast period. China, Taiwan, and Europe are the leading markets, with the US soon to join when the first large-scale offshore wind plants are commissioned in coming years along the northeast coast of the country. The report also examines the annual installed capacity of top global wind turbine original equipment manufacturers (OEMs) and related market share and ranking. The most recent year-end 2018 data shows Denmark-based Vestas retaking the global total annual capacity lead and three other Western OEMs falling in the global total annual rankings. The turbine OEM market dynamics show consolidation throughout the sector, with top OEMs commanding larger market shares.
The report, Global Wind Energy Overview, analyzes the global wind power market to assess current and future development cycles and projections for new installed wind capacity. The study provides an analysis of the market issues related to wind development, including drivers and barriers such as power contract auction rates, volume, and related policy and market environments. Global market forecasts, segmented by region, extend through 2028. The report also summarizes the key industry players related to wind power development. An Executive Summary of the report is available for free download on the Navigant Research website.
Related Stories

Market Data | Jun 23, 2020
7 must reads for the AEC industry today: June 23, 2020
Gyms are going bacnkrupt and leaving gaps in shopping centers and how hotels are trying to keep guests and employees safe.

Market Data | Jun 22, 2020
New House infrastructure package will provide needed investments in aging infrastructure, support economic recovery, and create jobs
The Moving Forward Act’s proposed $1.5 trillion in new investments will improve range of public infrastructure, creating needed demand for construction while making the economy more efficient.

Market Data | Jun 22, 2020
7 must reads for the AEC industry today: June 22, 2020
Construction employment rises from April to May in 45 states and the first building in the U.S. designed for post COVID-19 environment.
Market Data | Jun 22, 2020
Construction employment rises from April to May in 45 states, slips in 5
Rebound from April job losses reflects one-shot help from paycheck protection program loans and easing of stay-at-home orders, but cancellations and state and local deficits imply further cuts ahead.

Market Data | Jun 19, 2020
7 must reads for the AEC industry today: June 19, 2020
Brown University's first housing building in three decades and demand for family rentals expected to jump.

Market Data | Jun 18, 2020
New data shows construction activity returning to pre-coronavirus levels in many parts of the country
Association survey and data collected by Procore measure impacts of the pandemic, showing signs of a construction recovery, but labor shortages and project cancellations show industry needs federal help.

Market Data | Jun 18, 2020
AIA releases strategies and illustrations for reducing risk of COVID-19 in schools
For the 2020-21 school year, districts are facing the difficult task of determining if K-12 schools will reopen this fall.

Market Data | Jun 18, 2020
6 must reads for the AEC industry today: June 18, 2020
Northbrook's new cannabis dispensary and America's structural steel industry remains a success story.

Market Data | Jun 17, 2020
6 must reads for the AEC industry today: June 17, 2020
Santa Fe becomes the second city in the world to achieve LEED v4.1 and the megacity is dead.

Market Data | Jun 16, 2020
7 must reads for the AEC industry today: June 16, 2020
Tottenham Hotspur Stadium has its own brewery and workers want policy changes before they return to offices.


