


Transwestern’s latest national office report reflects resilience in market fundamentals, even in the face of the moderating pace of U.S. economic growth demonstrated by net job creation averaging 172,000 per month for the first half of the year. In this environment, the national vacancy rate held steady at 9.7% in the second quarter thanks to healthy preleasing levels of newly delivered office assets.
“Signals continue to point to a disciplined office market that will perform well through year-end,” said Elizabeth Norton, Managing Director of Research at Transwestern. “Especially noteworthy is that in the second quarter, annual asking rental rates grew 4.2% year over year, the fastest rate this cycle and well above the five-year average of 3.4%.”
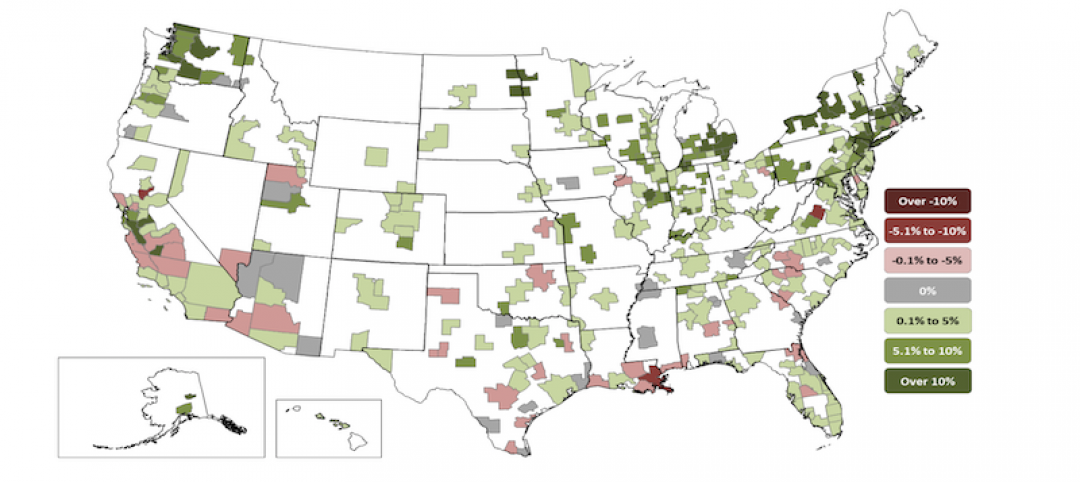
At quarter end, the average asking rental rate was $26.83 per square foot. Annual rent growth has been strongest in Tampa, Florida (10.6%), followed by Nashville, Tennessee (9.5%); San Jose/Silicon Valley, California (9.4%); Austin, Texas (8.8%); and San Francisco (8.8%).
Additionally, net absorption more than doubled to 24 million square feet in the second quarter despite sublet space adding 1.9 million square feet back to available inventory. Absorption leaders during the past year include Seattle; Charlotte, North Carolina; Dallas-Fort Worth; Los Angeles; and Northern Virginia. Seattle posted nearly 6 million square feet of absorption during the past 12 months, bringing the metro’s vacancy rate down to 6.1%, the fourth-lowest of the 49 markets tracked by Transwestern.
Office construction activity hit its highest level of this cycle, growing 9.6% during the prior 12 months. The second quarter saw more than 21.7 million square feet of new space added to inventory, and this pace will continue through the remainder of the year. Currently, 163.6 million square feet is in the pipeline nationally.
Download the full Second Quarter 2019 U.S. Office Market Report at: http://twurls.com/us-office-
Related Stories

Market Data | Aug 4, 2020
7 must reads for the AEC industry today: August 4, 2020
Construction spending decreases for fourth consecutive month and 100% affordable housing development breaks ground in Mountain View.
Market Data | Aug 3, 2020
Construction spending decreases for fourth consecutive month in June
Association officials warn further contraction is likely unless federal government enacts prompt, major investment in infrastructure as state and local governments face deficits.

Market Data | Aug 3, 2020
6 must reads for the AEC industry today: August 3, 2020
The future is a number game for retail and restaurants and 5 reasons universities are renovating student housing.

Market Data | Jul 31, 2020
5 must reads for the AEC industry today: July 31, 2020
Vegas's newest resort and casino is packed with contactless technology and Mariott, Hilton, and IHG dominate the U.S. hotel construction pipeline.

Market Data | Jul 30, 2020
Marriott, Hilton, and IHG continue to dominate the U.S. hotel construction pipeline at Q2’20 close
Hilton’s Home2 Suites and IHG’s Holiday Inn Express continue to be the most prominent brands in the U.S. pipeline.

Market Data | Jul 30, 2020
7 must reads for the AEC industry today: July 30, 2020
Millennium Tower finally has a fix and construction costs decrease for the first time in 10 years.
Market Data | Jul 29, 2020
62% of metros shed construction jobs from June 2019 to June 2020 as Association calls for new infrastructure funding, other relief steps
New York City and Brockton-Bridgewater-Easton, Mass. have worst 12-month losses, while Austin and Walla Walla, Wash. top job gainers.

Market Data | Jul 29, 2020
6 must reads for the AEC industry today: July 29, 2020
The world's first net-zero airport and California utility adopts climate emergency declaration.

Market Data | Jul 28, 2020
For the fourth consecutive quarter, Los Angeles leads the U.S. hotel construction pipeline at the close of Q2’ 20
New York City continues to have the greatest number of projects under construction, with 106 projects/18,354 rooms.

Market Data | Jul 28, 2020
6 must reads for the AEC industry today: July 28, 2020
St. Petersburg Pier reconstruction completes and post-pandemic workplace design will not be the same for all.


