


Transwestern’s latest national office report reflects resilience in market fundamentals, even in the face of the moderating pace of U.S. economic growth demonstrated by net job creation averaging 172,000 per month for the first half of the year. In this environment, the national vacancy rate held steady at 9.7% in the second quarter thanks to healthy preleasing levels of newly delivered office assets.
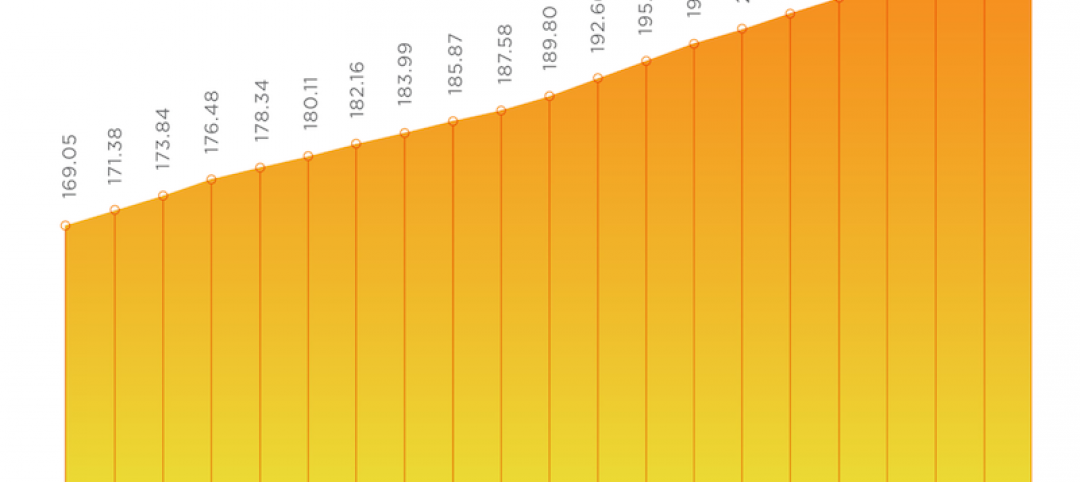
“Signals continue to point to a disciplined office market that will perform well through year-end,” said Elizabeth Norton, Managing Director of Research at Transwestern. “Especially noteworthy is that in the second quarter, annual asking rental rates grew 4.2% year over year, the fastest rate this cycle and well above the five-year average of 3.4%.”
At quarter end, the average asking rental rate was $26.83 per square foot. Annual rent growth has been strongest in Tampa, Florida (10.6%), followed by Nashville, Tennessee (9.5%); San Jose/Silicon Valley, California (9.4%); Austin, Texas (8.8%); and San Francisco (8.8%).
Additionally, net absorption more than doubled to 24 million square feet in the second quarter despite sublet space adding 1.9 million square feet back to available inventory. Absorption leaders during the past year include Seattle; Charlotte, North Carolina; Dallas-Fort Worth; Los Angeles; and Northern Virginia. Seattle posted nearly 6 million square feet of absorption during the past 12 months, bringing the metro’s vacancy rate down to 6.1%, the fourth-lowest of the 49 markets tracked by Transwestern.
Office construction activity hit its highest level of this cycle, growing 9.6% during the prior 12 months. The second quarter saw more than 21.7 million square feet of new space added to inventory, and this pace will continue through the remainder of the year. Currently, 163.6 million square feet is in the pipeline nationally.
Download the full Second Quarter 2019 U.S. Office Market Report at: http://twurls.com/us-office-
Related Stories

Market Data | Jan 29, 2021
Multifamily housing construction outlook soars in late 2020
Exceeds pre-COVID levels, reaching highest mark since 1st quarter 2018.

Market Data | Jan 29, 2021
The U.S. hotel construction pipeline stands at 5,216 projects/650,222 rooms at year-end 2020
At the end of Q4 ‘20, projects currently under construction stand at 1,487 projects/199,700 rooms.

Multifamily Housing | Jan 27, 2021
2021 multifamily housing outlook: Dallas, Miami, D.C., will lead apartment completions
In its latest outlook report for the multifamily rental market, Yardi Matrix outlined several reasons for hope for a solid recovery for the multifamily housing sector in 2021, especially during the second half of the year.

Market Data | Jan 26, 2021
Construction employment in December trails pre-pandemic levels in 34 states
Texas and Vermont have worst February-December losses while Virginia and Alabama add the most.

Market Data | Jan 19, 2021
Architecture Billings continue to lose ground
The pace of decline during December accelerated from November.

Market Data | Jan 19, 2021
2021 construction forecast: Nonresidential building spending will drop 5.7%, bounce back in 2022
Healthcare and public safety are the only nonresidential construction sectors that will see growth in spending in 2021, according to AIA's 2021 Consensus Construction Forecast.

Market Data | Jan 13, 2021
Atlanta, Dallas seen as most favorable U.S. markets for commercial development in 2021, CBRE analysis finds
U.S. construction activity is expected to bounce back in 2021, after a slowdown in 2020 due to challenges brought by COVID-19.
Market Data | Jan 13, 2021
Nonres construction could be in for a long recovery period
Rider Levett Bucknall’s latest cost report singles out unemployment and infrastructure spending as barometers.

Market Data | Jan 13, 2021
Contractor optimism improves as ABC’s Construction Backlog inches up in December
ABC’s Construction Confidence Index readings for sales, profit margins, and staffing levels increased in December.

Market Data | Jan 11, 2021
Turner Construction Company launches SourceBlue Brand
SourceBlue draws upon 20 years of supply chain management experience in the construction industry.


