


After dipping in the previous two quarters to levels unseen in nearly a decade, the Multifamily-for-Rent outlook for design and construction firms returned to pre-COVID levels in the 3rd Quarter, according to the PSMJ Resources’ Quarterly Market Forecast (QMF). The market’s net plus/minus index (NPMI) reached 40% for the 3rd Quarter, following quarters of -2% and +7%, respectively, in the first half of 2020. The negative index in the 1st Quarter was the first for the Multifamily market since 2010.
"The entire Housing market is showing impressive growth potential based on A/E proposal activity,” said PSMJ Senior Principal David Burstein, PE, AECPM. “This view is reinforced by government statistics for housing permits and new home starts. Multifamily housing (apartment buildings) took a brief pause from its 10-year growth surge when the COVID-19 crisis first hit in March, but has since recovered quite nicely. The condominium market actually saw a significant dip this spring, but more recently is showing signs of recovery, albeit not to the same levels as Multifamily-for-Rent.”
PSMJ’s NPMI expresses the difference between the percentage of firms reporting an increase in proposal activity and those reporting a decrease. The QMF has proven to be a solid predictor of market health for the architecture and engineering (A/E) industry since its inception in 2003. A consistent group of over 300 A/E firm leaders participate regularly, with 162 contributing to the most recent survey.
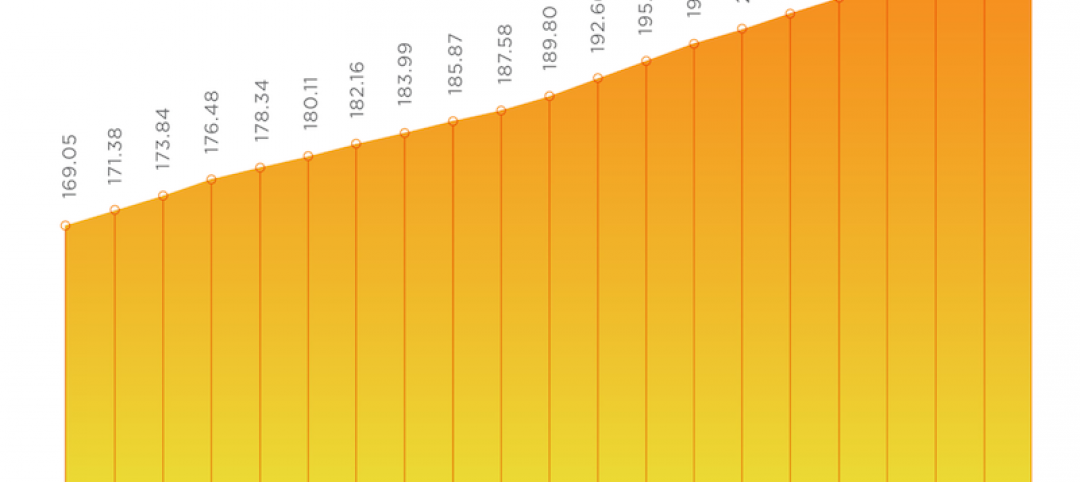
Multifamily-for-Rent Market Proposal Activity – 1Q08 to 3Q20 (NPMI)

The Multifamily market returned to positive territory out of the Great Recession in the 4th Quarter of 2010 with an NPMI of 24%, then jumped to 44% in the 4th Quarter of 2011. It never dropped below 41% again until it plummeted from 54% in the 4th Quarter of 2019 to -2% in the 1st Quarter of 2020.
“Many of the factors that drove Multifamily's growth pre-COVID remain in place,” adds Burstein. “Plus, there is now a new factor – the potential flight of many people from cities to suburbs – which is shifting the location of the demand. So we believe the Multifamily market will continue to be strong into the foreseeable future.”
Condominium proposal activity soared to a positive NPMI of 11% in the 3rd Quarter, up from -26% in the 2nd Quarter. The Condo market took longer to recover from the last recession than Multifamily-for-Rent did, not rebounding to positive numbers until late 2012. Its NPMI generally stayed in the 20% and 30% range for the next seven years running, until plummeting from 22% in the 4th Quarter of 2019 to a nine-year low of -28% in the 1st Quarter of 2020.
Condominium Market Proposal Activity – 1Q08 to 3Q20 (NPMI)

The Multifamily rebound was part of overall improving conditions for the Housing market, which paced all 12 of the major markets assessed in the QMF with an overall NPMI of 38%. Among other Housing submarkets, Single-Family Property (individual houses) also recorded a 40% NPMI (up from 9%), with Single-Family Development (Subdivisions) at 27%, up from -12%, and Senior & Assisted Living (Independent Living) at 26%, up from -1%,.
Among the 12 major markets surveyed, Water/Wastewater was a close second to Housing at 37%, followed by Healthcare (30%), Energy/Utilities (28%) and Light Industry (27%). Overall proposal activity across all markets and submarkets returned to growth mode in the 3rd Quarter with an NPMI of 22%, up from -10% in the 2nd Quarter. The three worst-performing major markets in the 3rd Quarter were Education (-36%), Commercial Users (-31%) and Commercial Developers (-21%).
PSMJ Resources, a consulting and publishing company dedicated to the A/E industry, has conducted its Quarterly Market Forecast for more than 17 years. It includes data on 12 major markets and 58 submarkets served by A/E firms. For more information, go to https://www.psmj.com/surveys/quarterly-market-forecast-2.
Related Stories

Market Data | Jan 29, 2021
Multifamily housing construction outlook soars in late 2020
Exceeds pre-COVID levels, reaching highest mark since 1st quarter 2018.

Market Data | Jan 29, 2021
The U.S. hotel construction pipeline stands at 5,216 projects/650,222 rooms at year-end 2020
At the end of Q4 ‘20, projects currently under construction stand at 1,487 projects/199,700 rooms.

Multifamily Housing | Jan 27, 2021
2021 multifamily housing outlook: Dallas, Miami, D.C., will lead apartment completions
In its latest outlook report for the multifamily rental market, Yardi Matrix outlined several reasons for hope for a solid recovery for the multifamily housing sector in 2021, especially during the second half of the year.

Market Data | Jan 26, 2021
Construction employment in December trails pre-pandemic levels in 34 states
Texas and Vermont have worst February-December losses while Virginia and Alabama add the most.

Market Data | Jan 19, 2021
Architecture Billings continue to lose ground
The pace of decline during December accelerated from November.

Market Data | Jan 19, 2021
2021 construction forecast: Nonresidential building spending will drop 5.7%, bounce back in 2022
Healthcare and public safety are the only nonresidential construction sectors that will see growth in spending in 2021, according to AIA's 2021 Consensus Construction Forecast.

Market Data | Jan 13, 2021
Atlanta, Dallas seen as most favorable U.S. markets for commercial development in 2021, CBRE analysis finds
U.S. construction activity is expected to bounce back in 2021, after a slowdown in 2020 due to challenges brought by COVID-19.
Market Data | Jan 13, 2021
Nonres construction could be in for a long recovery period
Rider Levett Bucknall’s latest cost report singles out unemployment and infrastructure spending as barometers.

Market Data | Jan 13, 2021
Contractor optimism improves as ABC’s Construction Backlog inches up in December
ABC’s Construction Confidence Index readings for sales, profit margins, and staffing levels increased in December.

Market Data | Jan 11, 2021
Turner Construction Company launches SourceBlue Brand
SourceBlue draws upon 20 years of supply chain management experience in the construction industry.


