


Multifamily housing construction is expected to remain relatively strong throughout 2014, according to Freddie Mac (http://bit.ly/TJvZ8R). Starts picked up in 2013, with completions due to catch up this year, finally approaching pre-recession levels.
AEC firms are delivering projects that cater to consumers seeking reasonably priced rentals in hot urban markets. Gen Y consumers are more likely than their Boomer antecedents to embrace the notion of renting as a lifelong strategy.
Noting these trends, a Building Team in the Southeast has developed SkyHouse: a branded program that provides high-rise apartments for Gen Y professionals near urban centers, public transportation, and nightlife. Since 2011, eleven SkyHouses have been developed, including finished properties in Orlando, Fla., Austin, Texas, Atlanta, Houston, and Dallas, and buildings under way in Raleigh, N.C., Atlanta, Tampa, Fla., Houston, and Charlotte, N.C.
Novare Group, which is developing the projects with Batson-Cook Development Company, previously specialized in high-rise condos, and wanted to bring a different approach to apartment towers that would cost only marginally more than low to mid-rise multifamily housing.
The SkyHouses consist of vertically stacked units with minimal variation; interiors are tweaked to reflect local market preferences. Separating parking facilities from the towers has reduced construction time and costs.
Jones Lang LaSalle’s U.S. Multifamily Outlook Year-End 2013 (http://bit.ly/1ifRCC4) notes the growing (and “thriving”) activity in this region: “While the housing recovery is causing expansion nationwide, the mending of the hardest hit housing markets in the Sunbelt is driving significant gains in those metros.”
Top Multifamily Architecture Firms
| Rank | Company | 2013 Multifamily Revenue |
| 1 | RTKL Associates | $29,674,000 |
| 2 | Niles Bolton Associates | 26,257,959 |
| 3 | Solomon Cordwell Buenz | 26,000,000 |
| 4 | Architects Orange | 18,989,853 |
| 5 | WDG Architecture | 18,737,000 |
| 6 | Stantec | 17,622,016 |
| 7 | Perkins Eastman | 16,000,000 |
| 8 | NORR | 11,572,227 |
| 9 | Ziegler Cooper | 8,815,451 |
| 10 | Skidmore, Owings & Merrill | 8,702,356 |
| 11 | FXFOWLE Architects | 8,100,000 |
| 12 | Good Fulton & Farrell | 7,931,000 |
| 13 | Hord Coplan Macht | 7,794,838 |
| 14 | HOK | 7,404,036 |
| 15 | Smallwood, Reynolds, Stewart, Stewart & Associates | 7,338,774 |
| 16 | Gensler | 7,139,176 |
| 17 | Perkins+will | 7,100,000 |
| 18 | Mithun | 5,966,000 |
| 19 | Rule Joy Trammell + Rubio | 5,787,000 |
| 20 | FitzGerald Associates Architects | 5,464,276 |
| 21 | VOA Associates | 5,266,818 |
| 22 | Cooper Carry | 5,055,632 |
| 23 | OZ Architecture | 4,879,000 |
| 24 | Beyer Blinder Belle | 4,780,731 |
| 25 | ZGF Architects | 4,770,730 |
| 26 | Harley Ellis Devereaux | 4,670,000 |
| 27 | HKS | 4,641,794 |
| 28 | Lord Aeck Sargent | 4,585,731 |
| 29 | EDI International | 4,538,210 |
| 30 | GBBN Architects | 4,120,000 |
| 31 | Eppstein Uhen Architects | 3,912,939 |
| 32 | Kohn Pedersen Fox Associates | 3,795,000 |
| 33 | Hensley Lamkin Rachel | 3,120,000 |
| 34 | BLTa | 3,100,000 |
| 35 | IBI Group ? Gruzen Samton | 3,000,000 |
| 36 | Nadel | 3,000,000 |
| 37 | Shepley Bulfinch | 2,803,000 |
| 38 | Moseley Architects | 2,774,269 |
| 39 | Callison | 2,697,208 |
| 40 | Carrier Johnson + Culture | 2,638,036 |
| 41 | Morris Architects | 2,240,000 |
| 42 | Cuningham Group Architecture | 2,149,438 |
| 43 | Montroy Andersen DeMarco | 2,130,000 |
| 44 | MBH Architects | 1,940,000 |
| 45 | NAC|Architecture | 1,871,525 |
| 46 | Commonwealth Architects | 1,627,175 |
| 47 | Corgan | 1,596,285 |
| 48 | Symmes Maini & McKee Associates | 1,560,000 |
| 49 | Clark Nexsen | 1,400,000 |
| 50 | Page | 1,400,000 |
| 51 | Goettsch Partners | 1,400,000 |
| 52 | WATG | Wimberly Interiors | 1,388,000 |
| 53 | Goodwyn Mills & Cawood | 1,328,694 |
| 54 | Cambridge Seven Associates | 1,277,000 |
| 55 | Nelson | 1,254,686 |
| 56 | Hnedak Bobo Group | 1,205,000 |
| 57 | Swanke Hayden Connell Architects | 1,200,000 |
| 58 | Ratio Architects | 1,127,764 |
| 59 | LS3P | 1,052,598 |
| 60 | Kirksey | 967,711 |
| 61 | Sherlock, Smith & Adams | 934,000 |
| 62 | CTA Architects Engineers | 831,135 |
| 63 | Leo A Daly | 824,915 |
| 64 | Hoffmann Architects | 747,000 |
| 65 | Epstein | 740,000 |
| 66 | PGAL | 736,900 |
| 67 | Environetics | 655,268 |
| 68 | NBBJ | 544,000 |
| 69 | Davis Brody Bond | 522,616 |
| 70 | ATA Beilharz Architects | 495,285 |
| 71 | Hoefer Wysocki Architecture | 410,000 |
| 72 | Adache Group Architects | 400,000 |
| 73 | BLDD Architects | 390,000 |
| 74 | P+R Architects | 381,150 |
| 75 | Moody Nolan | 361,308 |
| 76 | Poskanzer Skott | 350,000 |
| 77 | RNL | 310,000 |
| 78 | RSP Architects | 264,000 |
| 79 | Vocon | 262,947 |
| 80 | CASCO Diversified Corp. | 225,000 |
| 81 | Baskervill | 218,225 |
| 82 | Heery International | 196,283 |
| 83 | Becker Morgan Group | 192,043 |
| 84 | JRS Architect | 185,000 |
| 85 | H3 Hardy Collaboration Architecture | 183,452 |
| 86 | Ennead Architects | 168,902 |
| 87 | Wight & Company | 161,000 |
| 88 | Colkitt & Company | 100,000 |
| 89 | Ashley McGraw Architects | 83,478 |
| 90 | Integrus Architecture | 59,840 |
| 91 | Margulies Perruzzi Architects | 48,409 |
| 92 | KZF Design | 26,017 |
| 93 | TEG Architects | 20,879 |
| 94 | Harvard Jolly Architecture | 17,585 |
Top Multifamily Engineering Firms
| Rank | Company | 2013 Multifamily Revenue |
| 1 | AECOM Technology Corp. | $121,890,000 |
| 2 | URS Corp. | 56,953,263 |
| 3 | Parsons Brinckerhoff | 36,412,208 |
| 4 | WSP Group | 24,860,000 |
| 5 | Wiss, Janney, Elstner Associates | 21,180,000 |
| 6 | DeSimone Consulting Engineers | 20,620,346 |
| 7 | Jacobs | 15,370,000 |
| 8 | Thornton Tomasetti | 14,452,161 |
| 9 | Simpson Gumpertz & Heger | 11,690,000 |
| 10 | Magnusson Klemencic Associates | 10,137,916 |
| 11 | STV | 8,519,000 |
| 12 | Arup | 6,211,364 |
| 13 | KPFF Consulting Engineers | 6,000,000 |
| 14 | Bala Consulting Engineers | 5,083,000 |
| 15 | Dewberry | 4,849,178 |
| 16 | Interface Engineering | 3,522,946 |
| 17 | M-E Engineers | 3,429,000 |
| 18 | Martin/Martin | 2,558,401 |
| 19 | CTLGroup | 2,330,000 |
| 20 | Paulus, Sokolowski and Sartor | 2,100,000 |
| 21 | Glumac | 1,779,976 |
| 22 | Aon Fire Protection Engineering Corp. | 1,700,000 |
| 23 | AKF Group | 1,642,000 |
| 24 | Allen & Shariff | 1,500,000 |
| 25 | Vanderweil Engineers | 1,494,000 |
| 26 | KCI Technologies | 1,300,000 |
| 27 | RDK Engineers | 1,240,000 |
| 28 | Davis, Bowen & Friedel | 1,176,676 |
| 29 | Coffman Engineers | 1,161,281 |
| 30 | M/E Engineering | 1,034,842 |
| 31 | French & Parrello Associates | 972,500 |
| 32 | Graef | 821,802 |
| 33 | I. C. Thomasson Associates | 810,000 |
| 34 | SSOE Group | 793,545 |
| 35 | Smith Seckman Reid | 784,137 |
| 36 | TLC Engineering for Architecture | 780,974 |
| 37 | OLA Consulting Engineers | 695,000 |
| 38 | CJL Engineering | 662,940 |
| 39 | Spectrum Engineers | 557,881 |
| 40 | GHT Limited | 510,000 |
| 41 | Guernsey | 417,874 |
| 42 | RMF Engineering | 400,000 |
| 43 | H&A Architects & Engineers | 400,000 |
| 44 | Sparling | 393,807 |
| 45 | Karpinski Engineering | 370,666 |
| 46 | Walter P Moore and Associates | 364,810 |
| 47 | Joseph R. Loring & Associates | 320,000 |
| 48 | Barge Waggoner Sumner & Cannon | 320,000 |
| 49 | Stanley Consultants | 301,510 |
| 50 | Environmental Systems Design | 290,666 |
| 51 | Highland Associates | 250,000 |
| 52 | Wallace Engineering | 233,000 |
| 53 | Henderson Engineers | 231,482 |
| 54 | TTG | 216,150 |
| 55 | Zak Companies | 188,814 |
| 56 | G&W Engineering Corp. | 178,400 |
| 57 | Wick Fisher White | 156,293 |
| 58 | Newcomb & Boyd | 133,995 |
| 59 | Leidos | 120,000 |
| 60 | Apogee Consulting Group | 96,875 |
| 61 | Dunham Associates | 50,000 |
| 62 | P2S Engineering | 31,535 |
| 63 | Heapy Engineering | 19,441 |
| 64 | Total Building Commissioning | 18,405 |
| 65 | Brinjac Engineering | 12,960 |
Top Multifamily Construction Firms
| Rank | Company | 2013 Multifamily Revenue |
| 1 | Lend Lease | $1,680,438,000 |
| 2 | Clark Group | 832,640,000 |
| 3 | Balfour Beatty US | 686,819,862 |
| 4 | Plaza Construction | 670,000,000 |
| 5 | Swinerton Builders | 503,250,000 |
| 6 | Suffolk Construction | 452,592,931 |
| 7 | Adolfson & Peterson Construction | 325,225,509 |
| 8 | PCL Construction | 287,254,951 |
| 9 | Weis Builders | 270,383,000 |
| 10 | James McHugh Construction | 264,613,678 |
| 11 | Walsh Group, The | 254,726,672 |
| 12 | Turner Construction | 244,990,000 |
| 13 | Summit Contracting Group | 240,984,366 |
| 14 | Whiting-Turner Contracting Co., The | 238,617,178 |
| 15 | Batson-Cook | 225,076,882 |
| 16 | Tutor Perini Corp. | 216,439,042 |
| 17 | JE Dunn Construction | 204,409,132 |
| 18 | Harkins Builders | 168,000,000 |
| 19 | McShane Companies, The | 164,546,476 |
| 20 | Brasfield & Gorrie | 163,127,667 |
| 21 | Hunt Companies | 148,155,000 |
| 22 | Bernards | 144,000,000 |
| 23 | James G. Davis Construction | 123,693,698 |
| 24 | Kitchell Corp. | 123,591,618 |
| 25 | Skanska USA | 118,105,783 |
| 26 | Weitz Company, The | 104,812,724 |
| 27 | Gilbane | 104,239,380 |
| 28 | DPR Construction | 102,599,861 |
| 29 | Hensel Phelps | 99,310,000 |
| 30 | C.W. Driver | 91,430,000 |
| 31 | LeChase Construction Services | 78,720,000 |
| 32 | Power Construction | 74,000,000 |
| 33 | W. M. Jordan Company | 72,475,701 |
| 34 | Bette Companies, The | 72,287,000 |
| 35 | Ryan Companies US | 57,491,712 |
| 36 | URS Corp. | 56,953,263 |
| 37 | Structure Tone | 50,290,000 |
| 38 | Flintco | 46,600,000 |
| 39 | Douglas Company, The | 45,166,765 |
| 40 | Hoar Construction | 44,342,000 |
| 41 | Layton Construction | 43,600,000 |
| 42 | CORE Construction Group | 42,926,217 |
| 43 | Absher Construction | 41,419,197 |
| 44 | Hill International | 40,000,000 |
| 45 | HITT Contracting | 36,700,000 |
| 46 | Parsons Brinckerhoff | 36,412,208 |
| 47 | Walbridge | 34,000,000 |
| 48 | Paric Corp. | 34,000,000 |
| 49 | Robins & Morton | 33,809,050 |
| 50 | Hunt Construction Group | 32,000,000 |
| 51 | O'Neil Industries/W.E. O'Neil | 31,098,921 |
| 52 | Kraus-Anderson Construction | 31,000,000 |
| 53 | Yates Companies, The | 29,600,000 |
| 54 | Choate Construction | 29,008,583 |
| 55 | Manhattan Construction | 25,932,000 |
| 56 | Austin Commercial | 25,565,808 |
| 57 | Linbeck Group | 21,000,000 |
| 58 | Haselden Construction | 19,911,322 |
| 59 | Juneau Construction | 19,007,317 |
| 60 | Beck Group, The | 18,964,678 |
| 61 | Messer Construction | 18,394,464 |
| 62 | KBE Building Corp. | 13,628,837 |
| 63 | STV | 8,519,000 |
| 64 | Bomel Construction | 7,894,058 |
| 65 | LPCiminelli | 7,437,315 |
| 66 | Consigli Construction | 5,542,121 |
| 67 | IMC Construction | 4,556,000 |
| 68 | Pepper Construction | 2,870,000 |
| 69 | Coakley & Williams Construction | 1,994,991 |
| 70 | Allen & Shariff | 1,500,000 |
| 71 | Stalco Construction | 1,010,000 |
| 72 | EBCO General Contractor | 895,700 |
| 73 | JLL | 840,400 |
| 74 | S. M. Wilson & Co. | 722,352 |
| 75 | New South Construction | 205,000 |
| 76 | Heery International | 196,283 |
| 77 | Hill & Wilkinson | 191,000 |
Read BD+C's full 2014 Giants 300 Report
Related Stories
Performing Arts Centers | May 10, 2022
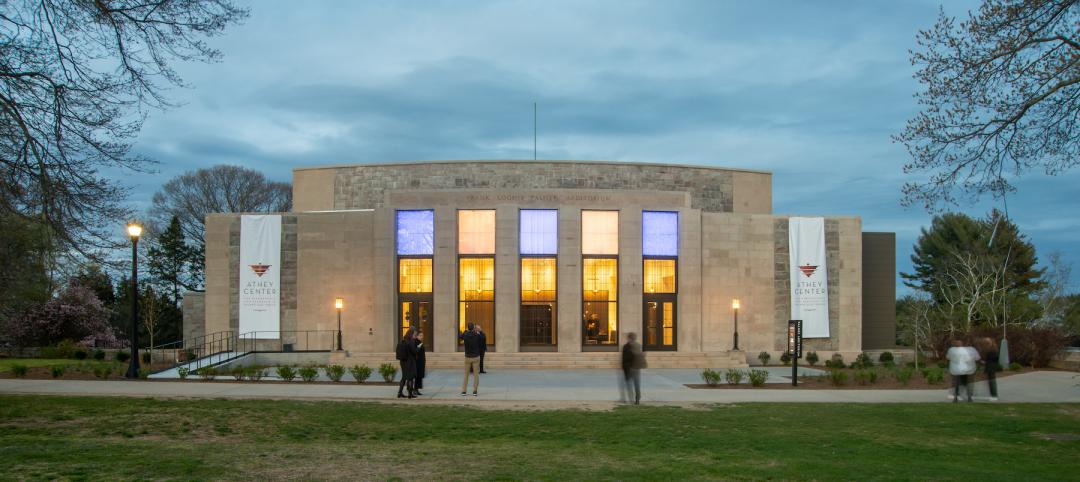
A historic performance space is transformed to reinforce a campus’ Arts District
Connecticut College’s Athey Center for Performance and Research at Palmer Auditorium balances the old and new.

Market Data | May 10, 2022
Hybrid work could result in 20% less demand for office space
Global office demand could drop by between 10% and 20% as companies continue to develop policies around hybrid work arrangements, a Barclays analyst recently stated on CNBC.

Multifamily Housing | May 10, 2022
Multifamily rents up 14.3% in 2022
The average U.S. asking rent for multifamily housing increased $15 in April to an all-time high of $1,659, according to Yardi Matrix.

Headquarters | May 10, 2022
JPMorgan Chase’s new all-electric headquarters to have net-zero operational emissions
JPMorgan Chase’s recently unveiled plans for its new global headquarters building in New York City that is rife with impressive sustainability credentials.

Building Team | May 9, 2022
Cincinnati’s Andrew J Brady Music Center transforms the city’s riverfront
In Cincinnati, Ohio, the Andrew J Brady Music Center aims to connect audiences with live music while transforming Cincinnati’s riverfront.
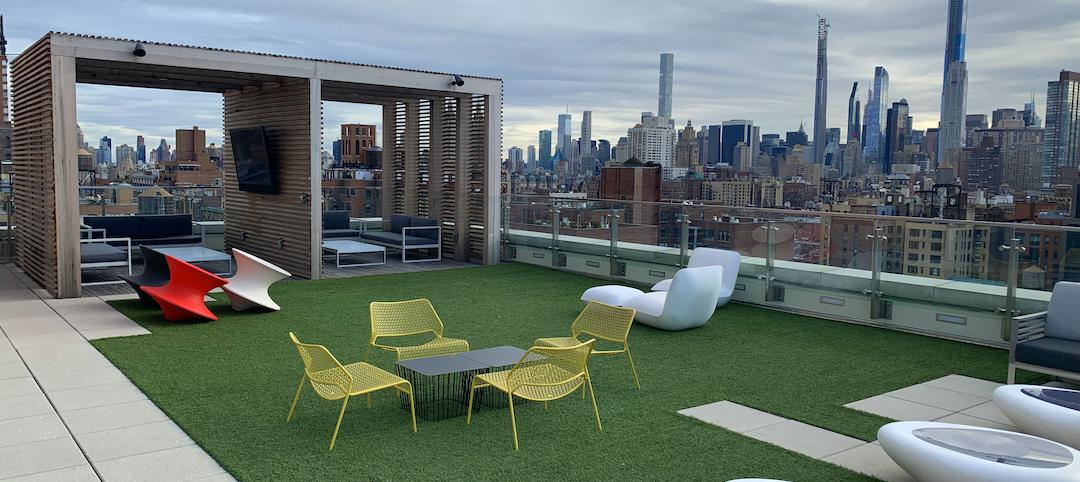
Sponsored | Multifamily Housing | May 8, 2022
Choosing the right paver system for rooftop amenity spaces
This AIA course by Hoffmann Architects offers best practices for choosing the right paver system for rooftop amenity spaces in multifamily buildings.

Market Data | May 6, 2022
Nonresidential construction spending down 1% in March
National nonresidential construction spending was down 0.8% in March, according to an Associated Builders and Contractors analysis of data published today by the U.S. Census Bureau.
Building Team | May 6, 2022
Atlanta’s largest adaptive reuse project features cross laminated timber
Global real estate investment and management firm Jamestown recently started construction on more than 700,000 sf of new live, work, and shop space at Ponce City Market.
Sponsored | BD+C University Course | May 5, 2022
Designing with architectural insulated metal wall panels
Insulated metal wall panels (IMPs) offer a sleek, modern, and lightweight envelope system that is highly customizable. This continuing education course explores the characteristics of insulated metal wall panels, including how they can offer a six-in-one design solution. Discussions also include design options, installation processes, code compliance, sustainability, and available warranties.

Higher Education | May 5, 2022
To keep pace with demand, higher ed will have to add 45,000 beds by year-end
The higher education residential sector will have to add 45,000 beds by the end of 2022 to keep pace with demand, according to a report by Humphreys & Partners Architects.


