


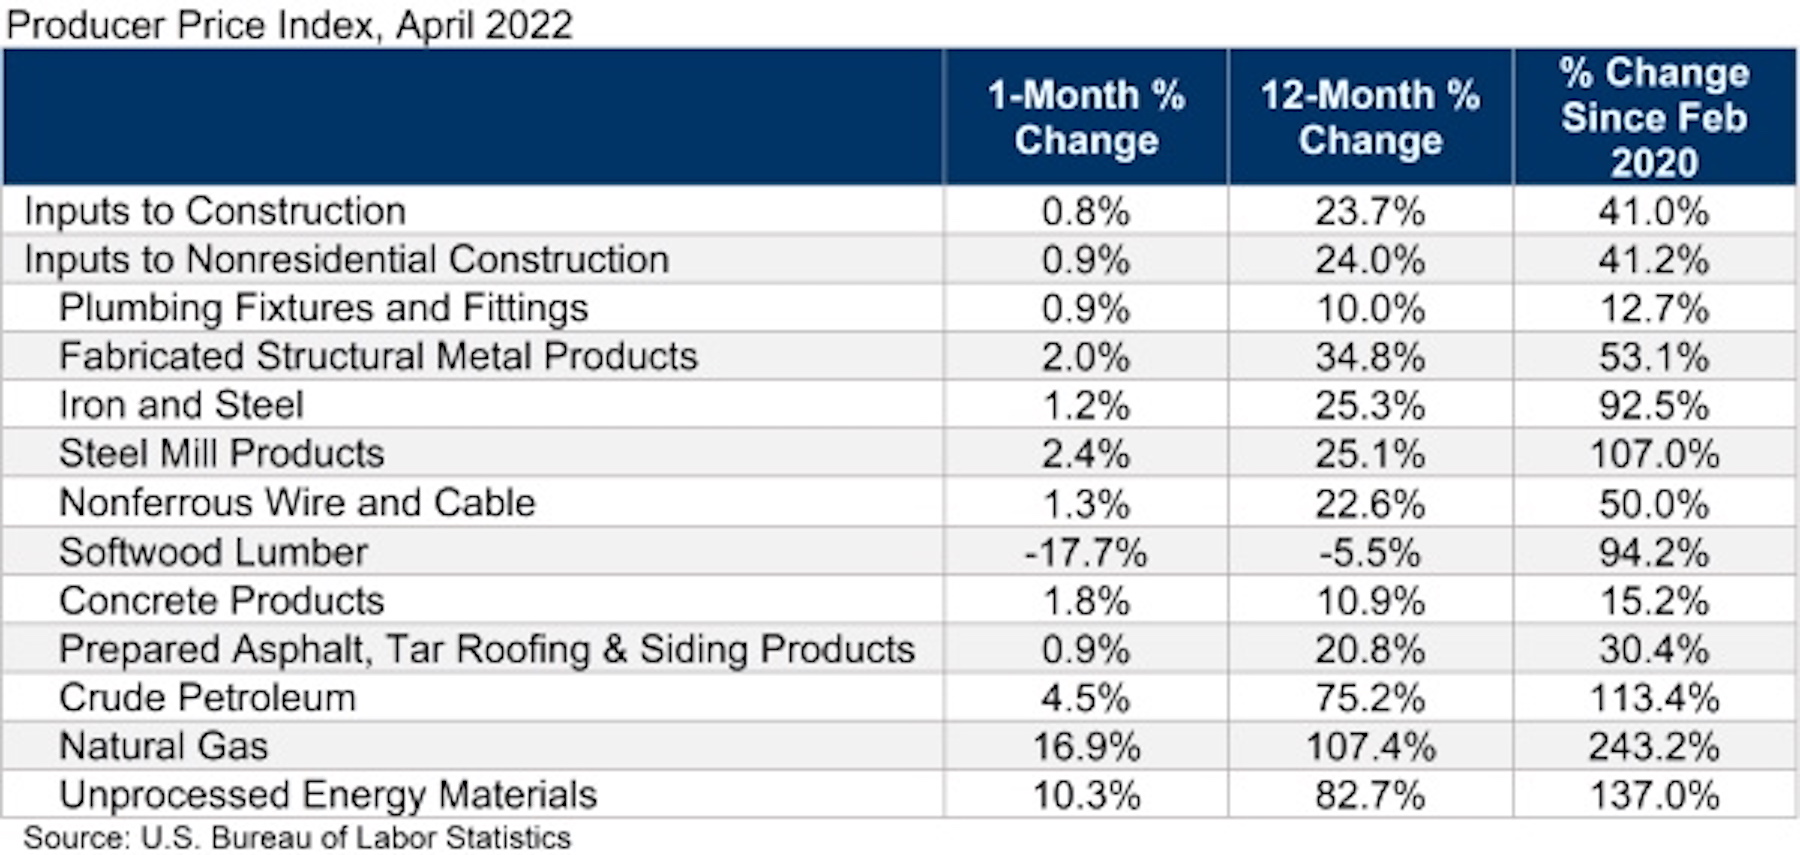
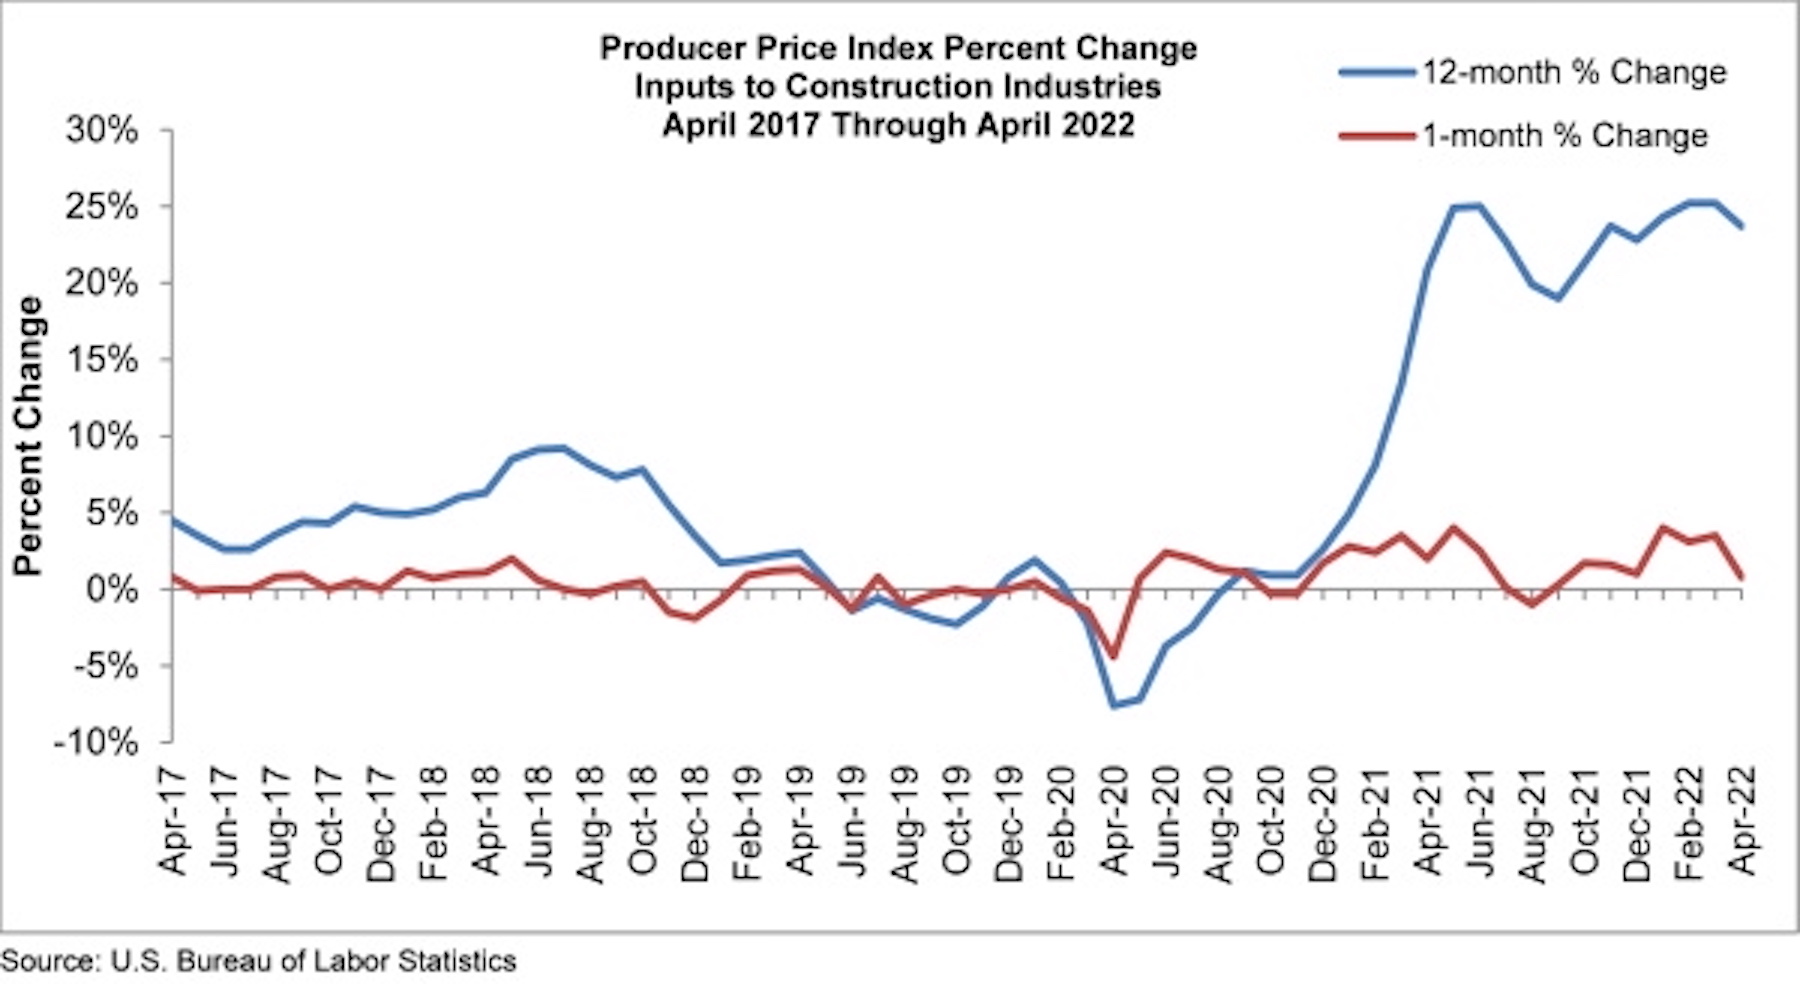
Construction input prices increased 0.8% in April compared to the previous month, according to an Associated Builders and Contractors analysis of U.S. Bureau of Labor Statistics’ Producer Price Index data released today. Nonresidential construction input prices rose 0.9% for the month.
Construction input prices are up 23.7% from a year ago, while nonresidential construction input prices are 24.0% higher. Input prices were up in 10 of 11 subcategories in April. Softwood lumber was the only category in which prices decreased, falling 17.7% for the month. The largest price increases were in natural gas (+16.9%) and unprocessed energy materials (+10.3%).
“There are some economists who believe that inflation has peaked,” said ABC Chief Economist Anirban Basu. “Even if that were true, stakeholders should not expect dramatic declines in inflation in the near term given an array of factors placing upward pressure on prices: the Russia-Ukraine war, COVID-19, a shrunken labor force, elevated transportation costs and abundant demand for goods. Today’s PPI release indicates that producers continue to ask for and receive elevated prices for their limited production. These high input prices will continue to circulate through the economy as production continues, whether in the form of manufactured goods, buildings or infrastructure.
“According to ABC’s Construction Confidence Index, many contractors report that demand for their services remains sufficiently robust for them to pass along the bulk of their cost increases to project owners,” said Basu. “But at some point, the economy could weaken to the point that purchasers of construction services become less willing to pay elevated prices.
“The Federal Reserve is now in the middle of what will likely prove a lengthy monetary tightening process, and higher borrowing costs are rendering project starts less likely, all things being equal. That said, certain segments are likely to power through this dynamic, should it happen. That includes public construction, given the recent passage and ongoing implementation of a large-scale American infrastructure package. It should be noted that recent inflation has reduced the return taxpayers will get per dollar spent on infrastructure.”
Related Stories

Contractors | Jun 13, 2023
The average U.S. contractor has 8.9 months worth of construction work in the pipeline, as of May 2023
Associated Builders and Contractors reported that its Construction Backlog Indicator remained unchanged at 8.9 months in May, according to an ABC member survey conducted May 20 to June 7. The reading is 0.1 months lower than in May 2022. Backlog in the infrastructure category ticked up again and has now returned to May 2022 levels. On a regional basis, backlog increased in every region but the Northeast.
Industry Research | Jun 13, 2023
Two new surveys track how the construction industry, in the U.S. and globally, is navigating market disruption and volatility
The surveys, conducted by XYZ Reality and KPMG International, found greater willingness to embrace technology, workplace diversity, and ESG precepts.

| Jun 5, 2023
Communication is the key to AEC firms’ mental health programs and training
The core of recent awareness efforts—and their greatest challenge—is getting workers to come forward and share stories.

Contractors | May 24, 2023
The average U.S. contractor has 8.9 months worth of construction work in the pipeline, as of April 2023
Contractor backlogs climbed slightly in April, from a seven-month low the previous month, according to Associated Builders and Contractors.

Multifamily Housing | May 23, 2023
One out of three office buildings in largest U.S. cities are suitable for residential conversion
Roughly one in three office buildings in the largest U.S. cities are well suited to be converted to multifamily residential properties, according to a study by global real estate firm Avison Young. Some 6,206 buildings across 10 U.S. cities present viable opportunities for conversion to residential use.

Industry Research | May 22, 2023
2023 High Growth Study shares tips for finding success in uncertain times
Lee Frederiksen, Managing Partner, Hinge, reveals key takeaways from the firm's recent High Growth study.

Multifamily Housing | May 8, 2023
The average multifamily rent was $1,709 in April 2023, up for the second straight month
Despite economic headwinds, the multifamily housing market continues to demonstrate resilience, according to a new Yardi Matrix report.

Market Data | May 2, 2023
Nonresidential construction spending up 0.7% in March 2023 versus previous month
National nonresidential construction spending increased by 0.7% in March, according to an Associated Builders and Contractors analysis of data published today by the U.S. Census Bureau. On a seasonally adjusted annualized basis, nonresidential spending totaled $997.1 billion for the month.

Hotel Facilities | May 2, 2023
U.S. hotel construction up 9% in the first quarter of 2023, led by Marriott and Hilton
In the latest United States Construction Pipeline Trend Report from Lodging Econometrics (LE), analysts report that construction pipeline projects in the U.S. continue to increase, standing at 5,545 projects/658,207 rooms at the close of Q1 2023. Up 9% by both projects and rooms year-over-year (YOY); project totals at Q1 ‘23 are just 338 projects, or 5.7%, behind the all-time high of 5,883 projects recorded in Q2 2008.

Market Data | May 1, 2023
AEC firm proposal activity rebounds in the first quarter of 2023: PSMJ report
Proposal activity for architecture, engineering and construction (A/E/C) firms increased significantly in the 1st Quarter of 2023, according to PSMJ’s Quarterly Market Forecast (QMF) survey. The predictive measure of the industry’s health rebounded to a net plus/minus index (NPMI) of 32.8 in the first three months of the year.


