


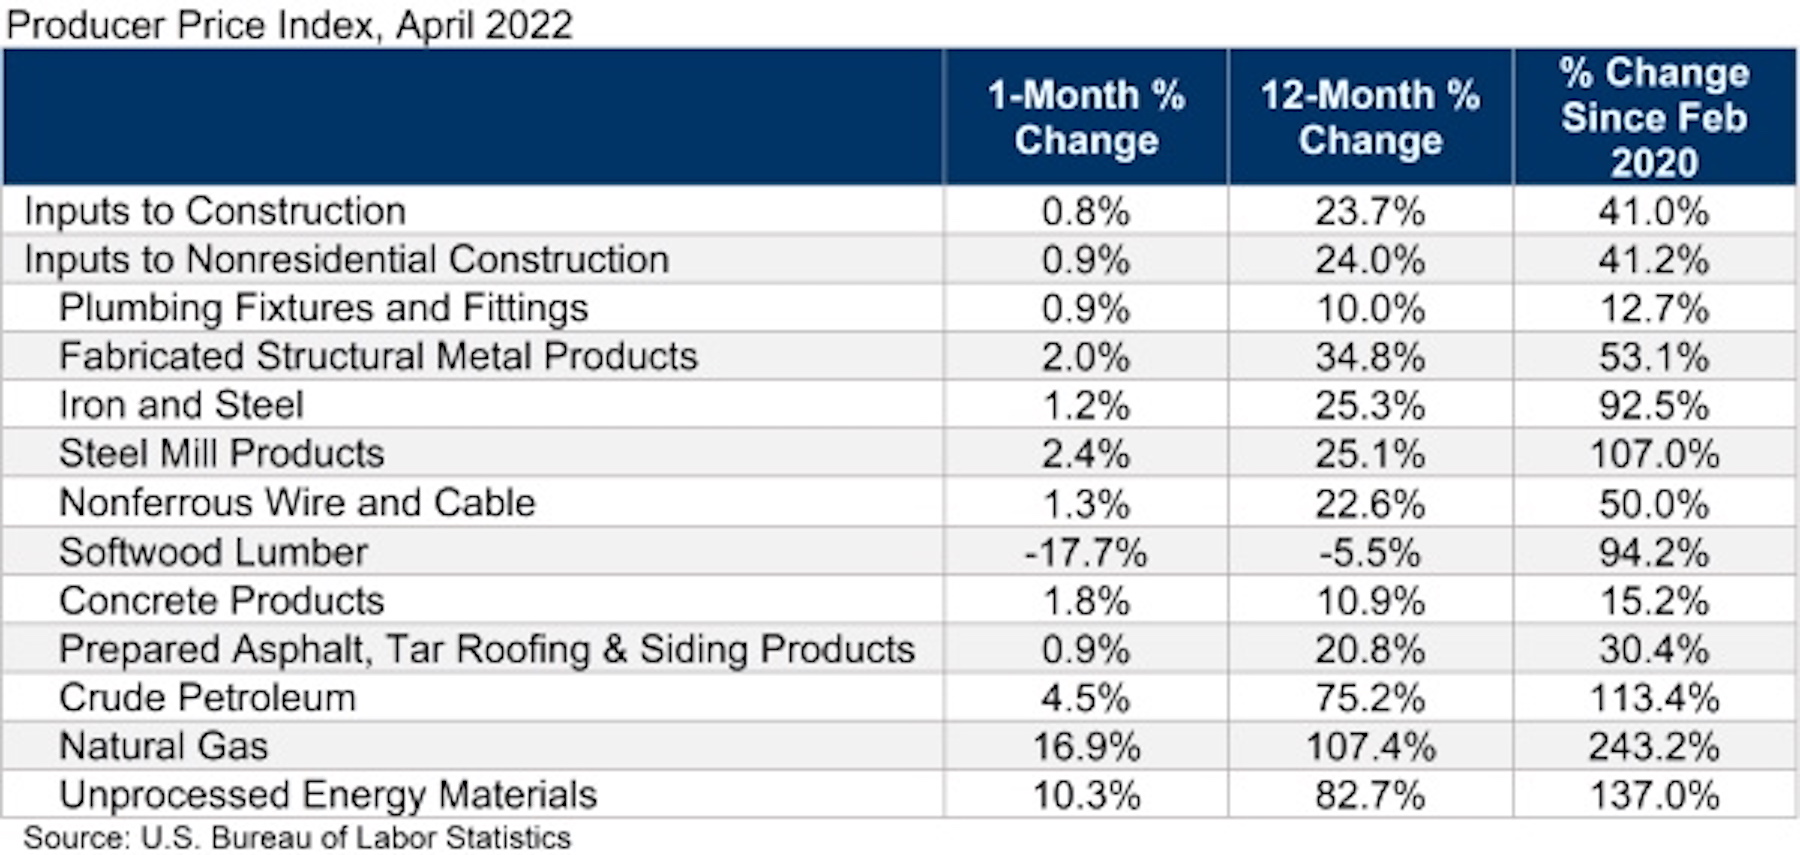
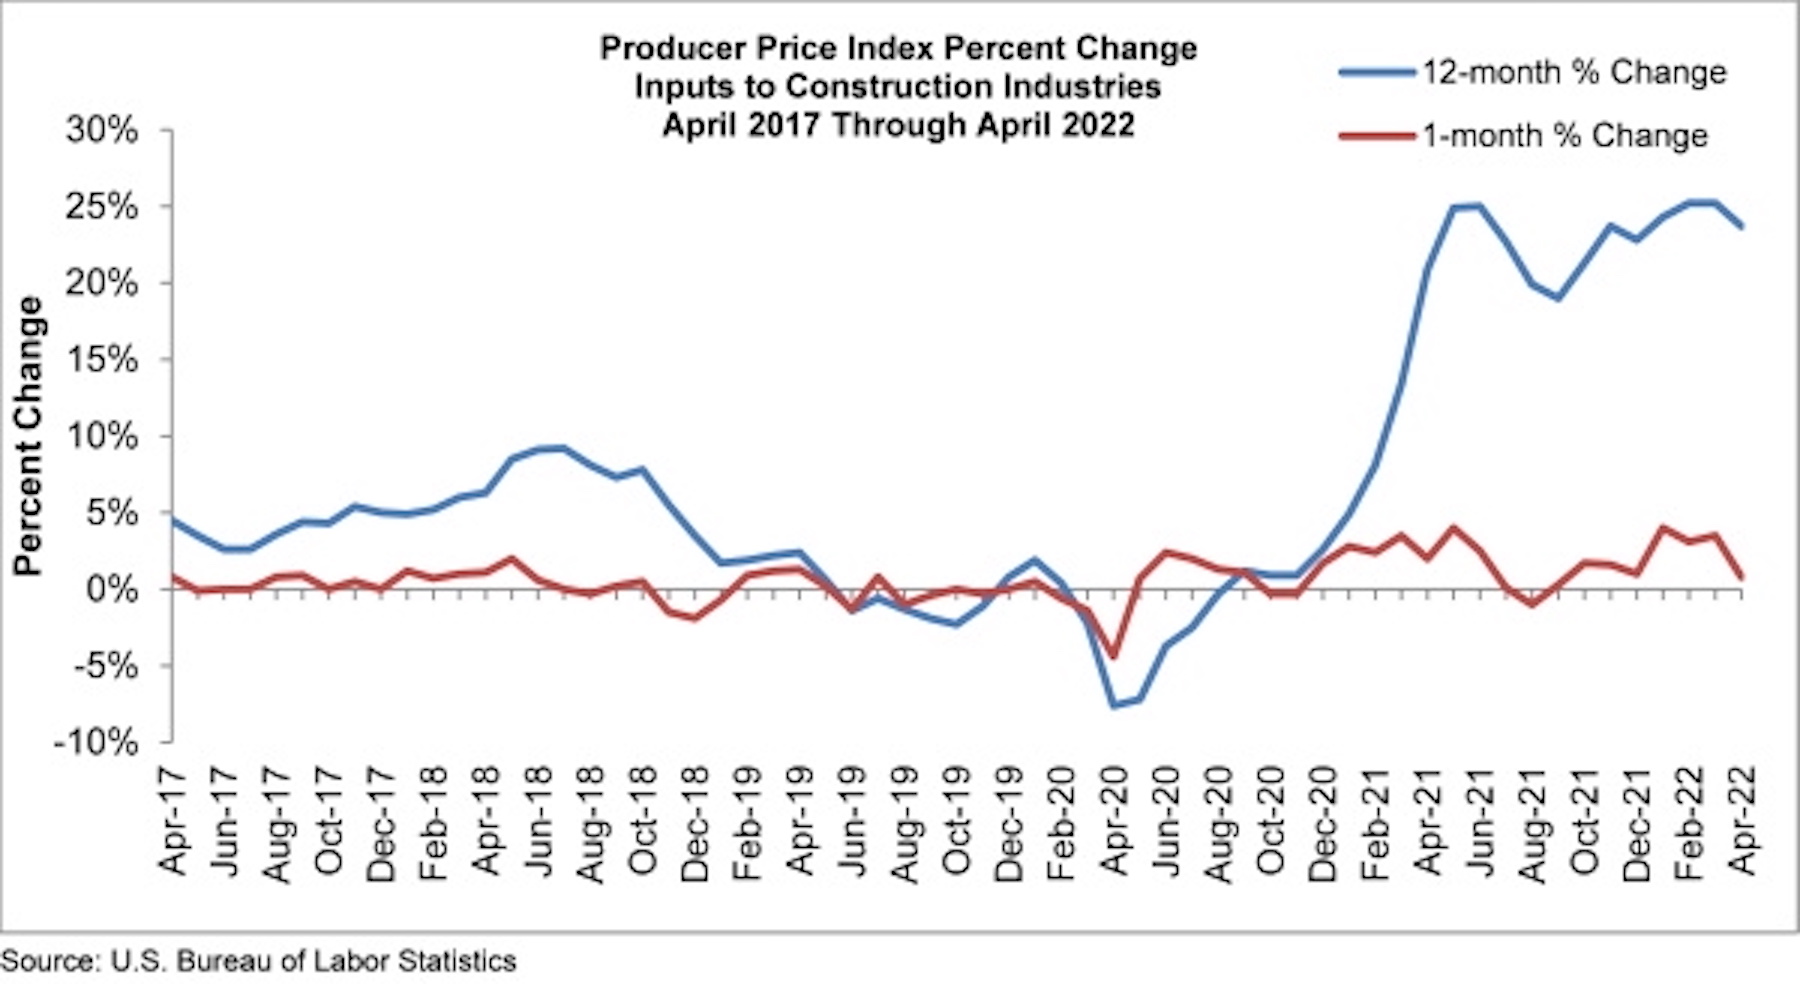
Construction input prices increased 0.8% in April compared to the previous month, according to an Associated Builders and Contractors analysis of U.S. Bureau of Labor Statistics’ Producer Price Index data released today. Nonresidential construction input prices rose 0.9% for the month.
Construction input prices are up 23.7% from a year ago, while nonresidential construction input prices are 24.0% higher. Input prices were up in 10 of 11 subcategories in April. Softwood lumber was the only category in which prices decreased, falling 17.7% for the month. The largest price increases were in natural gas (+16.9%) and unprocessed energy materials (+10.3%).
“There are some economists who believe that inflation has peaked,” said ABC Chief Economist Anirban Basu. “Even if that were true, stakeholders should not expect dramatic declines in inflation in the near term given an array of factors placing upward pressure on prices: the Russia-Ukraine war, COVID-19, a shrunken labor force, elevated transportation costs and abundant demand for goods. Today’s PPI release indicates that producers continue to ask for and receive elevated prices for their limited production. These high input prices will continue to circulate through the economy as production continues, whether in the form of manufactured goods, buildings or infrastructure.
“According to ABC’s Construction Confidence Index, many contractors report that demand for their services remains sufficiently robust for them to pass along the bulk of their cost increases to project owners,” said Basu. “But at some point, the economy could weaken to the point that purchasers of construction services become less willing to pay elevated prices.
“The Federal Reserve is now in the middle of what will likely prove a lengthy monetary tightening process, and higher borrowing costs are rendering project starts less likely, all things being equal. That said, certain segments are likely to power through this dynamic, should it happen. That includes public construction, given the recent passage and ongoing implementation of a large-scale American infrastructure package. It should be noted that recent inflation has reduced the return taxpayers will get per dollar spent on infrastructure.”
Related Stories

Market Data | Feb 9, 2021
USGBC top 10 states for LEED in 2020
The Top 10 States for LEED green building is based on gross square feet of certified space per person using 2010 U.S. Census data and includes commercial and institutional projects certified in 2020.

Market Data | Feb 8, 2021
Construction employment stalls in January with unemployment rate of 9.4%
New measures threaten to undermine recovery.

Market Data | Feb 4, 2021
Construction employment declined in 2020 in majority of metro areas
Houston-The Woodlands-Sugar Land and Brockton-Bridgewater-Easton, Mass. have worst 2020 losses, while Indianapolis-Carmel-Anderson, Ind. and Walla Walla, Wash. register largest gains in industry jobs.

Market Data | Feb 3, 2021
Construction spending diverges in December with slump in private nonresidential sector, mixed public work, and boom in homebuilding
Demand for nonresidential construction and public works will decline amid ongoing pandemic concerns.

Market Data | Feb 1, 2021
The New York City market is back on top and leads the U.S. hotel construction pipeline
New York City has the greatest number of projects under construction with 108 projects/19,439 rooms.

Market Data | Jan 29, 2021
Multifamily housing construction outlook soars in late 2020
Exceeds pre-COVID levels, reaching highest mark since 1st quarter 2018.

Market Data | Jan 29, 2021
The U.S. hotel construction pipeline stands at 5,216 projects/650,222 rooms at year-end 2020
At the end of Q4 ‘20, projects currently under construction stand at 1,487 projects/199,700 rooms.

Multifamily Housing | Jan 27, 2021
2021 multifamily housing outlook: Dallas, Miami, D.C., will lead apartment completions
In its latest outlook report for the multifamily rental market, Yardi Matrix outlined several reasons for hope for a solid recovery for the multifamily housing sector in 2021, especially during the second half of the year.

Market Data | Jan 26, 2021
Construction employment in December trails pre-pandemic levels in 34 states
Texas and Vermont have worst February-December losses while Virginia and Alabama add the most.

Market Data | Jan 19, 2021
Architecture Billings continue to lose ground
The pace of decline during December accelerated from November.


