


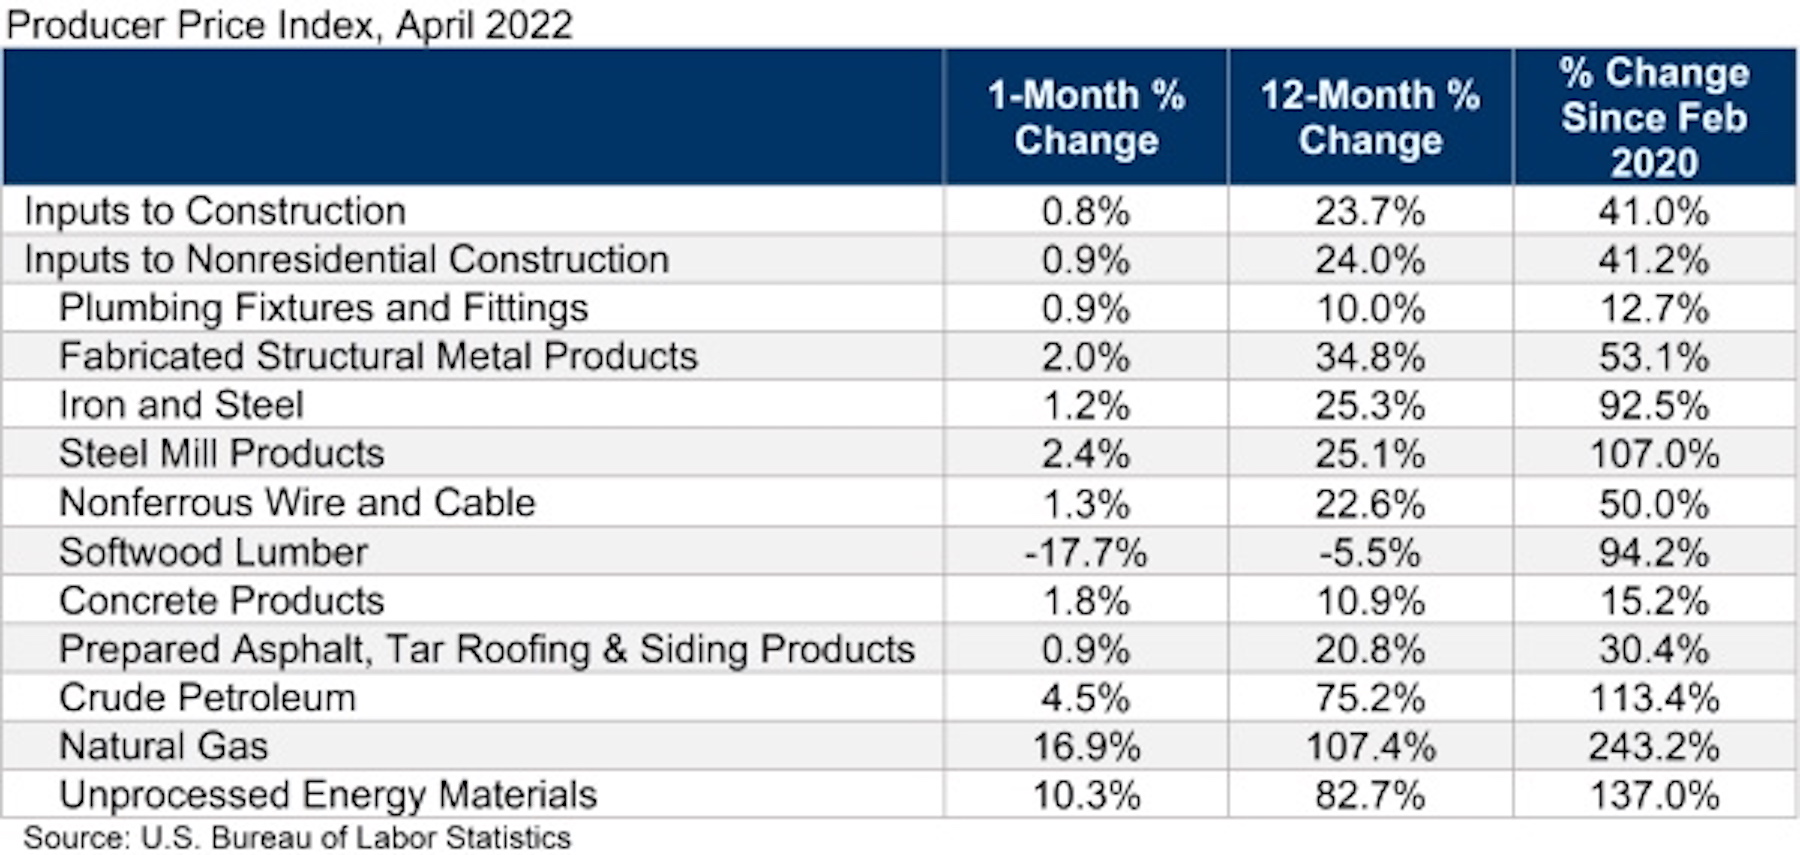
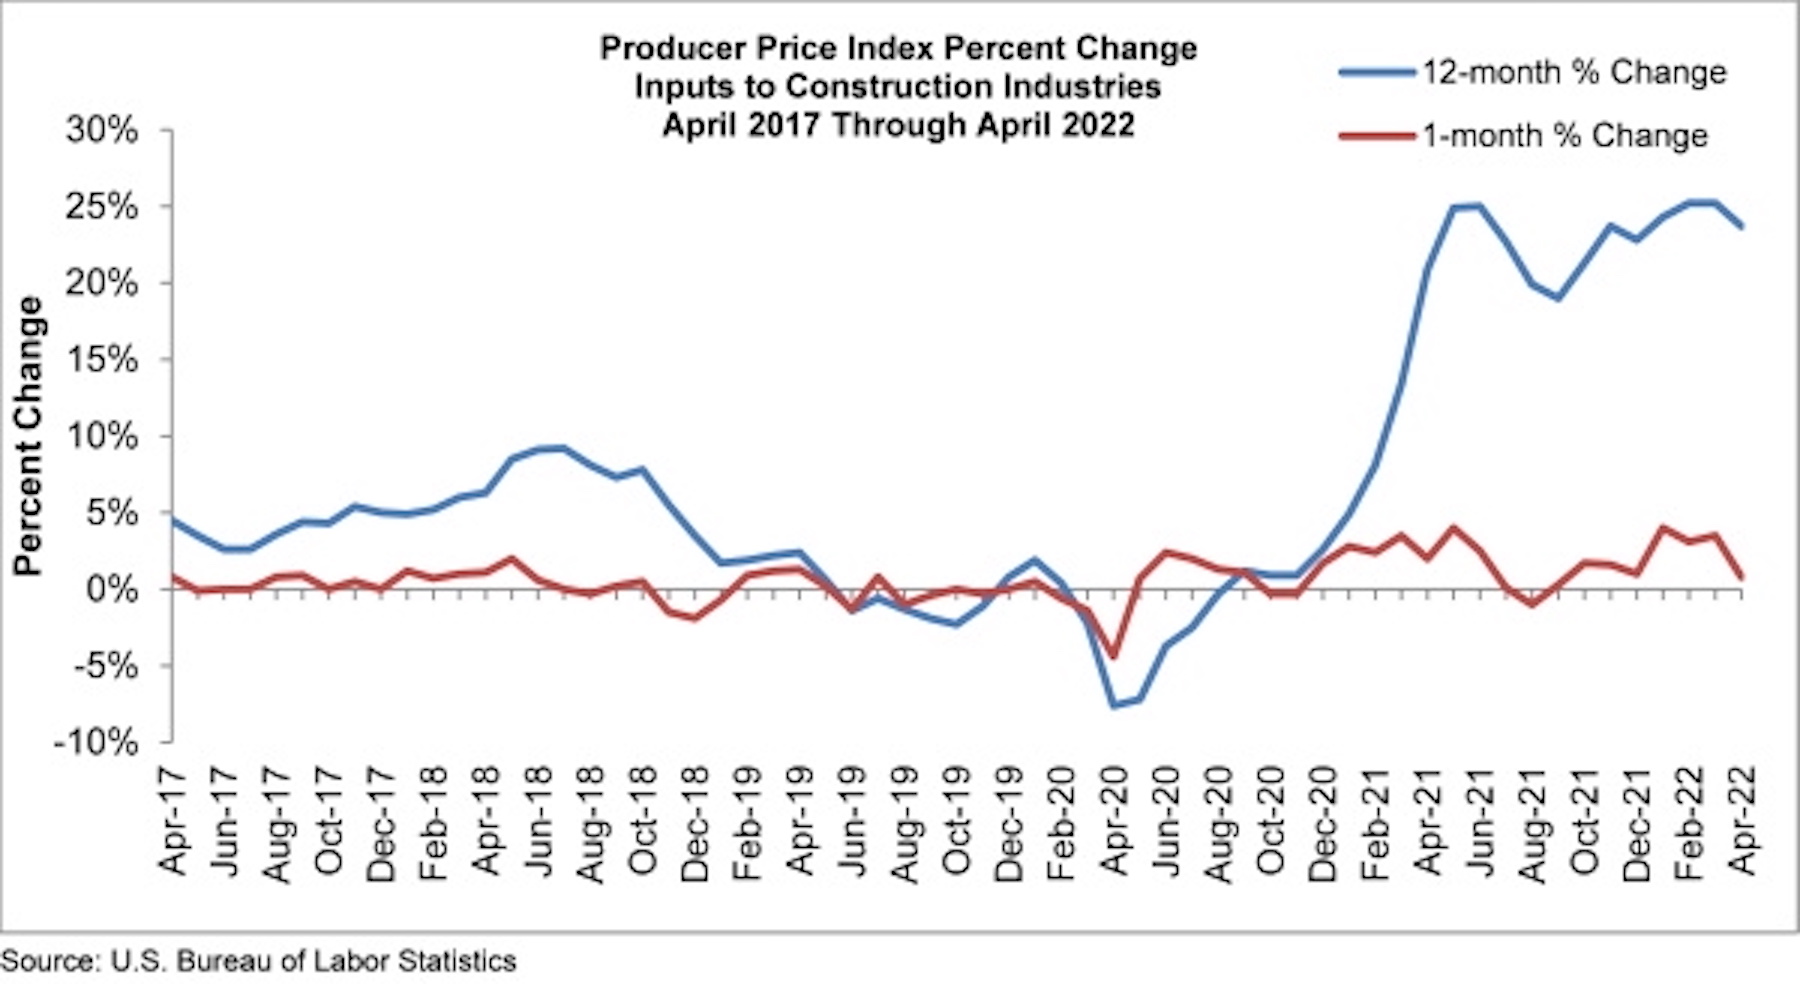
Construction input prices increased 0.8% in April compared to the previous month, according to an Associated Builders and Contractors analysis of U.S. Bureau of Labor Statistics’ Producer Price Index data released today. Nonresidential construction input prices rose 0.9% for the month.
Construction input prices are up 23.7% from a year ago, while nonresidential construction input prices are 24.0% higher. Input prices were up in 10 of 11 subcategories in April. Softwood lumber was the only category in which prices decreased, falling 17.7% for the month. The largest price increases were in natural gas (+16.9%) and unprocessed energy materials (+10.3%).
“There are some economists who believe that inflation has peaked,” said ABC Chief Economist Anirban Basu. “Even if that were true, stakeholders should not expect dramatic declines in inflation in the near term given an array of factors placing upward pressure on prices: the Russia-Ukraine war, COVID-19, a shrunken labor force, elevated transportation costs and abundant demand for goods. Today’s PPI release indicates that producers continue to ask for and receive elevated prices for their limited production. These high input prices will continue to circulate through the economy as production continues, whether in the form of manufactured goods, buildings or infrastructure.
“According to ABC’s Construction Confidence Index, many contractors report that demand for their services remains sufficiently robust for them to pass along the bulk of their cost increases to project owners,” said Basu. “But at some point, the economy could weaken to the point that purchasers of construction services become less willing to pay elevated prices.
“The Federal Reserve is now in the middle of what will likely prove a lengthy monetary tightening process, and higher borrowing costs are rendering project starts less likely, all things being equal. That said, certain segments are likely to power through this dynamic, should it happen. That includes public construction, given the recent passage and ongoing implementation of a large-scale American infrastructure package. It should be noted that recent inflation has reduced the return taxpayers will get per dollar spent on infrastructure.”
Related Stories

Market Data | Nov 5, 2021
Construction firms add 44,000 jobs in October
Gain occurs even as firms struggle with supply chain challenges.

Market Data | Nov 3, 2021
One-fifth of metro areas lost construction jobs between September 2020 and 2021
Beaumont-Port Arthur, Texas and Sacramento--Roseville--Arden-Arcade Calif. top lists of gainers.

Market Data | Nov 2, 2021
Construction spending slumps in September
A drop in residential work projects adds to ongoing downturn in private and public nonresidential.

Hotel Facilities | Oct 28, 2021
Marriott leads with the largest U.S. hotel construction pipeline at Q3 2021 close
In the third quarter alone, Marriott opened 60 new hotels/7,882 rooms accounting for 30% of all new hotel rooms that opened in the U.S.

Hotel Facilities | Oct 28, 2021
At the end of Q3 2021, Dallas tops the U.S. hotel construction pipeline
The top 25 U.S. markets account for 33% of all pipeline projects and 37% of all rooms in the U.S. hotel construction pipeline.

Market Data | Oct 27, 2021
Only 14 states and D.C. added construction jobs since the pandemic began
Supply problems, lack of infrastructure bill undermine recovery.

Market Data | Oct 26, 2021
U.S. construction pipeline experiences highs and lows in the third quarter
Renovation and conversion pipeline activity remains steady at the end of Q3 ‘21, with conversion projects hitting a cyclical peak, and ending the quarter at 752 projects/79,024 rooms.

Market Data | Oct 19, 2021
Demand for design services continues to increase
The Architecture Billings Index (ABI) score for September was 56.6.

Market Data | Oct 14, 2021
Climate-related risk could be a major headwind for real estate investment
A new trends report from PwC and ULI picks Nashville as the top metro for CRE prospects.

Market Data | Oct 14, 2021
Prices for construction materials continue to outstrip bid prices over 12 months
Construction officials renew push for immediate removal of tariffs on key construction materials.


