


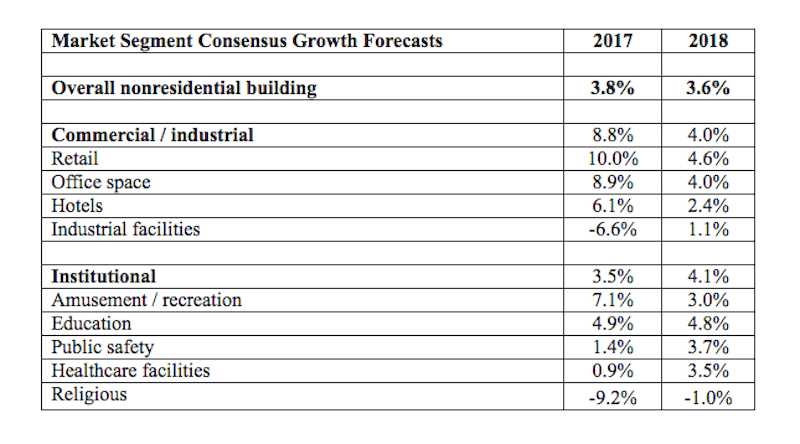
The AIA Consensus Construction Forecast projects annual growth in the 3.5 percent to 4.0 percent range for the remainder of 2017 as well as for 2018, with a slower growing commercial/industrial market, and an institutional sector facing several challenges. While some slowdown in the commercial sector was anticipated for 2017 and 2018, it was expected to be offset by acceleration in the institutional sector. However, year-to date growth in spending for institutional buildings is at only 3%, well below expectations when the year began.
“Despite billings at architecture firms performing quite well this year, the larger construction industry is facing a range of issues,” says AIA Chief Economist, Kermit Baker, PhD, Hon. AIA. “The somewhat weaker outlook is driven by several factors, some dealing with the broader U.S. economy, some dealing with general construction industry fundamentals, and some dealing with weakness in specific construction sectors.”
Learn more about the AIA Consensus Construction Forecast.
Related Stories

Market Data | Jun 21, 2019
Architecture billings remain flat
AIA’s Architecture Billings Index (ABI) score for May showed a small increase in design services at 50.2.

Market Data | Jun 19, 2019
Number of U.S. architects continues to rise
New data from NCARB reveals that the number of architects continues to increase.

Market Data | Jun 12, 2019
Construction input prices see slight increase in May
Among the 11 subcategories, six saw prices fall last month, with the largest decreases in natural gas.

Market Data | Jun 3, 2019
Nonresidential construction spending up 6.4% year over year in April
Among the 16 sectors tracked by the U.S. Census Bureau, nine experienced an increase in monthly spending, led by water supply and highway and street.

Market Data | Jun 3, 2019
4.1% annual growth in office asking rents above five-year compound annual growth rate
Market has experienced no change in office vacancy rates in three quarters.

Market Data | May 30, 2019
Construction employment increases in 250 out of 358 metros from April 2018 to April 2019
Demand for work is outpacing the supply of workers.

Market Data | May 24, 2019
Construction contractors confidence remains high in March
More than 70% of contractors expect to increase staffing levels over the next six months.

Market Data | May 22, 2019
Slight rebound for architecture billings in April
AIA’s ABI score for April showed a small increase in design services at 50.5 in April.

Market Data | May 9, 2019
The U.S. hotel construction pipeline continues to grow in the first quarter as the economy shows surprising strength
Projects currently under construction stand at 1,709 projects/227,924 rooms.

Market Data | May 9, 2019
Construction input prices continue to rise
Nonresidential input prices rose 0.9% compared to March and are up 2.8% on an annual basis.


