


Top Military Sector Architecture Firms
| Rank | Company | 2012 Military Revenue ($) |
| 1 | HDR Architecture | $63,546,903 |
| 2 | Heery International | $21,224,842 |
| 3 | HKS | $13,500,000 |
| 4 | HNTB Archtecture | $12,276,306 |
| 5 | Leo A Daly | $11,114,441 |
| 6 | RTKL Associates | $10,777,000 |
| 7 | Sherlock, Smith & Adams | $9,637,000 |
| 8 | VOA Associates | $8,354,050 |
| 9 | EwingCole | $8,000,000 |
| 10 | Corgan | $7,428,547 |
| 11 | Hoefer Wysocki Architecture | $7,221,000 |
| 12 | RSP Architects | $6,831,000 |
| 13 | Reynolds, Smith and Hills | $6,540,000 |
| 14 | HOK | $6,243,000 |
| 15 | EYP | $5,800,000 |
| 16 | LS3P | $5,065,979 |
| 17 | Hammel, Green and Abrahamson | $4,092,000 |
| 18 | Flad Architects | $3,484,000 |
| 19 | Emersion Design | $3,449,838 |
| 20 | KZF Design | $3,165,696 |
| 21 | RNL | $3,102,000 |
| 22 | Morris Architects | $2,900,000 |
| 23 | ZGF Architects | $2,654,318 |
| 24 | PGAL | $2,510,000 |
| 25 | Gensler | $2,500,000 |
| 26 | Skidmore, Owings & Merrill | $2,350,000 |
| 27 | IBI Group | $2,146,453 |
| 28 | Albert Kahn Family of Companies | $2,011,177 |
| 29 | CTA Architects Engineers | $1,762,047 |
| 30 | WHR Architects | $1,476,330 |
| 31 | SmithGroupJJR | $816,000 |
| 32 | Wight & Co. | $751,000 |
| 33 | OZ Architecture | $678,554 |
| 34 | Moseley Architects | $458,816 |
| 35 | Carrier Johnson + Culture | $367,935 |
| 36 | Harvard Jolly Architecture | $213,000 |
| 37 | Gresham, Smith and Partners | $180,318 |
| 38 | Fletcher-Thompson | $150,000 |
| 39 | SMMA | Symmes Maini & McKee Associates | $115,000 |
| 40 | Cooper Carry | $104,811 |
| 41 | TEG Architects - The Estopinal Group | $30,717 |
| 42 | WDG Architecture | $6,000 |
Top Military Sector Engineering Firms
| Rank | Company | 2012 Military Revenue ($) |
| 1 | Fluor | $2,063,244,000 |
| 2 | URS Corp. | $350,209,483 |
| 3 | AECOM Technology Corp. | $256,000,000 |
| 4 | Michael Baker Jr. | $70,890,000 |
| 5 | Science Applications International Corp. | $45,989,771 |
| 6 | Burns & McDonnell | $35,650,000 |
| 7 | Clark Nexsen | $27,896,498 |
| 8 | Allen & Shariff | $27,500,000 |
| 9 | Merrick & Co. | $20,000,000 |
| 10 | STV | $16,510,000 |
| 11 | Eaton Energy Solutions | $14,462,482 |
| 12 | Parsons Brinckerhoff | $12,293,193 |
| 13 | Guernsey | $9,746,352 |
| 14 | Barge, Waggoner, Sumner and Cannon | $9,000,000 |
| 15 | Affiliated Engineers | $4,112,000 |
| 16 | BRPH | $4,000,500 |
| 17 | KCI Technologies | $4,000,000 |
| 18 | Dewberry | $3,584,673 |
| 19 | Coffman Engineers | $3,025,000 |
| 20 | H&A Architects & Engineers | $2,998,476 |
| 21 | Wiss, Janney, Elstner Associates | $2,860,000 |
| 22 | TLC Engineering for Architecture | $2,586,925 |
| 23 | RMF Engineering Design | $2,500,000 |
| 24 | Ross & Baruzzini | $2,404,599 |
| 25 | Newcomb & Boyd | $2,166,918 |
| 26 | Sparling | $2,151,181 |
| 27 | KPFF Consulting Engineers | $2,000,000 |
| 27 | Rolf Jensen & Associates | $2,000,000 |
| 29 | Smith Seckman Reid | $1,273,546 |
| 30 | Bridgers & Paxton Consulting Engineers | $1,098,183 |
| 31 | Vanderweil Engineers | $1,078,000 |
| 32 | Heapy Engineering | $1,071,676 |
| 33 | TTG | $1,050,980 |
| 34 | CCRD Partners | $1,000,000 |
| 35 | Davis, Bowen & Friedel | $816,200 |
| 36 | Henderson Engineers | $779,884 |
| 37 | M-E Engineers | $750,000 |
| 38 | Interface Engineering | $572,371 |
| 39 | GRW | $487,940 |
| 40 | Spectrum Engineers | $436,740 |
| 41 | Aon Fire Protection Engineering | $400,000 |
| 41 | Paulus, Sokolowski and Sartor | $400,000 |
| 43 | Peter Basso Associates | $300,000 |
| 44 | Syska Hennessy Group | $278,129 |
| 45 | GRAEF | $259,738 |
| 46 | Apogee Consulting Group | $251,000 |
| 47 | KJWW Engineering Consultants | $242,970 |
| 48 | Simpson Gumpertz & Heger | $200,000 |
| 49 | H.F. Lenz | $180,000 |
| 50 | SSOE Group | $146,989 |
| 51 | Glumac | $128,000 |
| 52 | CTLGroup | $100,000 |
| 52 | Dunham Associates | $100,000 |
| 52 | Rist-Frost-Shumway Engineering | $100,000 |
| 55 | Total Building Commissioning | $71,349 |
| 56 | Walter P Moore | $29,068 |
| 57 | Brinjac Engineering | $16,166 |
| 58 | Environmental Systems Design | $10,000 |
| 59 | Shive-Hattery | $3,071 |
| 60 | CJL Engineering | $3,000 |
Top Military Sector Construction Firms
| Rank | Company | 2012 Military Revenue ($) |
| 1 | Balfour Beatty | $835,493,608 |
| 2 | Hensel Phelps | $705,861,979 |
| 3 | B. L. Harbert International | $504,804,208 |
| 4 | Clark Group | $459,441,089 |
| 5 | Lend Lease | $448,232,000 |
| 6 | ECC | $404,881,855 |
| 7 | JE Dunn Construction | $383,882,914 |
| 8 | Gilbane | $343,600,000 |
| 9 | Walsh Group, The | $312,117,849 |
| 10 | Manhattan Construction | $200,119,000 |
| 11 | Weitz Co., The | $190,000,000 |
| 12 | McCarthy Holdings | $182,000,000 |
| 13 | Whiting-Turner Contracting Co., The | $173,204,860 |
| 14 | Turner Corporation, The | $163,707,000 |
| 15 | Hunt Companies | $159,295,120 |
| 16 | Mortenson Construction | $141,767,000 |
| 17 | Swinerton Builders | $128,767,700 |
| 18 | Walbridge | $113,929,436 |
| 19 | Sundt Construction | $88,800,392 |
| 20 | CORE Construction Group | $82,025,741 |
| 21 | W. M. Jordan Co. | $72,506,220 |
| 22 | Yates Cos., The | $69,400,000 |
| 23 | Jones Lang LaSalle | $60,287,223 |
| 24 | Absher Construction | $55,810,000 |
| 25 | Haskell | $52,656,368 |
| 26 | Consigli Construction | $49,230,541 |
| 27 | Messer Construction | $33,725,402 |
| 28 | Skanska USA | $33,600,000 |
| 29 | Harkins Builders | $30,500,000 |
| 30 | Brasfield & Gorrie | $29,147,688 |
| 31 | Hunt Construction Group | $29,000,000 |
| 32 | Suffolk Construction | $28,999,924 |
| 33 | Barton Malow | $25,600,015 |
| 34 | PCL Construction Enterprises | $19,907,096 |
| 35 | Coakley & Williams Construction | $16,555,554 |
| 36 | New South Construction | $13,300,000 |
| 37 | S. M. Wilson & Co. | $9,637,564 |
| 38 | Hoffman Construction | $7,820,967 |
| 39 | C.W. Driver | $6,896,321 |
| 40 | Choate Construction | $4,921,619 |
| 41 | Robins & Morton | $4,200,000 |
| 42 | Bomel Construction | $2,400,000 |
| 43 | Flintco | $1,400,000 |
| 44 | KBE Building Corporation | $1,229,621 |
| 45 | Doster Construction | $1,124,889 |
| 46 | Hoar Construction | $1,101,000 |
| 47 | Graycor | $571,323 |
| 48 | Power Construction | $200,000 |
| 49 | Tutor Perini Corporation | $188,000 |
| 50 | Alberici Constructors | $100,186 |
| 51 | DPR Construction | $86,891 |
| 52 | E.W. Howell | $85,000 |
Read the full 2013 Giants 300 Report
Related Stories
| Feb 22, 2011
LEED Volume Program celebrates its 500th certified Pilot Project
More than 500 building projects have certified through the LEED Volume Program since the pilot launched in 2006, according to the U.S. Green Building Council. The LEED Volume Program streamlines the certification process for high-volume property owners and managers, from commercial real estate firms, national retailers and hospitality providers, to local, state and federal governments.
| Feb 15, 2011
New 2030 Challenge to include carbon footprint of building materials and products
Architecture 2030 has just broadened the scope of its 2030 Challenge, issuing an additional challenge regarding the climate impact of building products. The 2030 Challenge for Products aims to reduce the embodied carbon (meaning the carbon emissions equivalent) of building products 50% by 2030.

| Feb 14, 2011
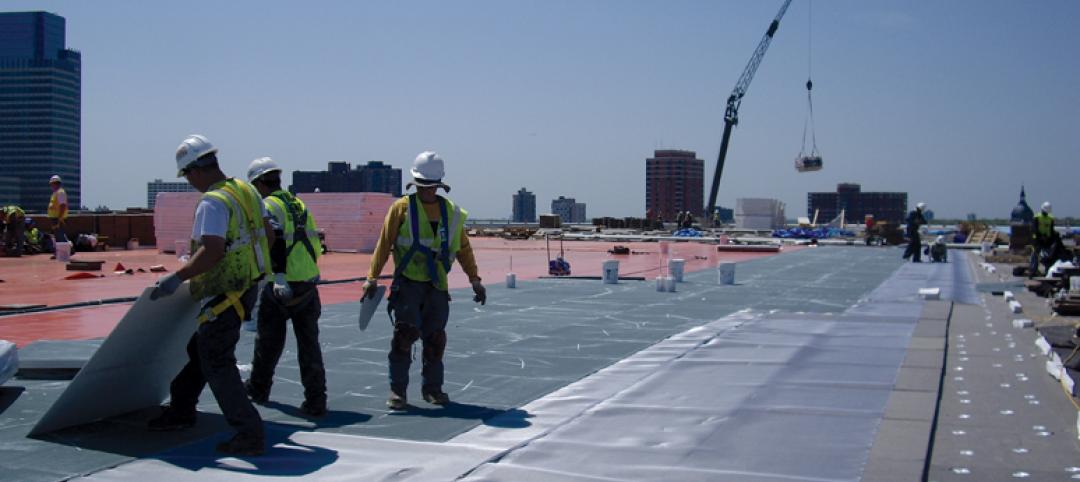
Sustainable Roofing: A Whole-Building Approach
According to sustainability experts, the first step toward designing an energy-efficient roofing system is to see roof materials and systems as an integral component of the enclosure and the building as a whole. Earn 1.0 AIA/CES learning units by studying this article and successfully completing the online exam.
| Feb 14, 2011
More companies willing to pay extra for green office space
New CoreNet Global/Jones Lang LaSalle survey shows real estate executives forging green strategies that balance environmental, financial and workforce issues.
| Feb 11, 2011
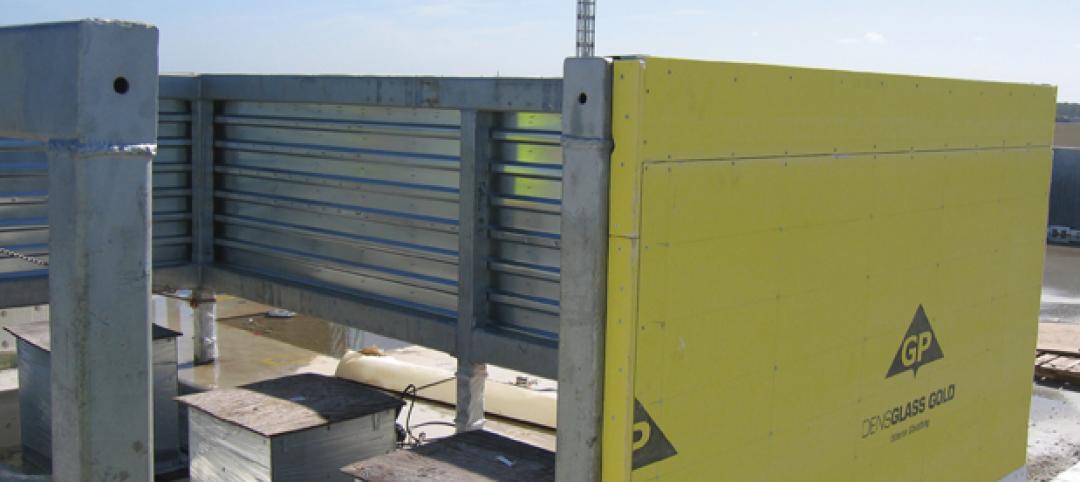
Four Products That Stand Up to Hurricanes
What do a panelized wall system, a newly developed roof hatch, spray polyurethane foam, and a custom-made curtain wall have in common? They’ve been extensively researched and tested for their ability to take abuse from the likes of Hurricane Katrina.
| Feb 11, 2011
RS Means Cost Comparison Chart: Office Buildings
This month's RS Means Cost Comparison Chart focuses on office building construction.


