


Top Military Sector Architecture Firms
| Rank | Company | 2012 Military Revenue ($) |
| 1 | HDR Architecture | $63,546,903 |
| 2 | Heery International | $21,224,842 |
| 3 | HKS | $13,500,000 |
| 4 | HNTB Archtecture | $12,276,306 |
| 5 | Leo A Daly | $11,114,441 |
| 6 | RTKL Associates | $10,777,000 |
| 7 | Sherlock, Smith & Adams | $9,637,000 |
| 8 | VOA Associates | $8,354,050 |
| 9 | EwingCole | $8,000,000 |
| 10 | Corgan | $7,428,547 |
| 11 | Hoefer Wysocki Architecture | $7,221,000 |
| 12 | RSP Architects | $6,831,000 |
| 13 | Reynolds, Smith and Hills | $6,540,000 |
| 14 | HOK | $6,243,000 |
| 15 | EYP | $5,800,000 |
| 16 | LS3P | $5,065,979 |
| 17 | Hammel, Green and Abrahamson | $4,092,000 |
| 18 | Flad Architects | $3,484,000 |
| 19 | Emersion Design | $3,449,838 |
| 20 | KZF Design | $3,165,696 |
| 21 | RNL | $3,102,000 |
| 22 | Morris Architects | $2,900,000 |
| 23 | ZGF Architects | $2,654,318 |
| 24 | PGAL | $2,510,000 |
| 25 | Gensler | $2,500,000 |
| 26 | Skidmore, Owings & Merrill | $2,350,000 |
| 27 | IBI Group | $2,146,453 |
| 28 | Albert Kahn Family of Companies | $2,011,177 |
| 29 | CTA Architects Engineers | $1,762,047 |
| 30 | WHR Architects | $1,476,330 |
| 31 | SmithGroupJJR | $816,000 |
| 32 | Wight & Co. | $751,000 |
| 33 | OZ Architecture | $678,554 |
| 34 | Moseley Architects | $458,816 |
| 35 | Carrier Johnson + Culture | $367,935 |
| 36 | Harvard Jolly Architecture | $213,000 |
| 37 | Gresham, Smith and Partners | $180,318 |
| 38 | Fletcher-Thompson | $150,000 |
| 39 | SMMA | Symmes Maini & McKee Associates | $115,000 |
| 40 | Cooper Carry | $104,811 |
| 41 | TEG Architects - The Estopinal Group | $30,717 |
| 42 | WDG Architecture | $6,000 |
Top Military Sector Engineering Firms
| Rank | Company | 2012 Military Revenue ($) |
| 1 | Fluor | $2,063,244,000 |
| 2 | URS Corp. | $350,209,483 |
| 3 | AECOM Technology Corp. | $256,000,000 |
| 4 | Michael Baker Jr. | $70,890,000 |
| 5 | Science Applications International Corp. | $45,989,771 |
| 6 | Burns & McDonnell | $35,650,000 |
| 7 | Clark Nexsen | $27,896,498 |
| 8 | Allen & Shariff | $27,500,000 |
| 9 | Merrick & Co. | $20,000,000 |
| 10 | STV | $16,510,000 |
| 11 | Eaton Energy Solutions | $14,462,482 |
| 12 | Parsons Brinckerhoff | $12,293,193 |
| 13 | Guernsey | $9,746,352 |
| 14 | Barge, Waggoner, Sumner and Cannon | $9,000,000 |
| 15 | Affiliated Engineers | $4,112,000 |
| 16 | BRPH | $4,000,500 |
| 17 | KCI Technologies | $4,000,000 |
| 18 | Dewberry | $3,584,673 |
| 19 | Coffman Engineers | $3,025,000 |
| 20 | H&A Architects & Engineers | $2,998,476 |
| 21 | Wiss, Janney, Elstner Associates | $2,860,000 |
| 22 | TLC Engineering for Architecture | $2,586,925 |
| 23 | RMF Engineering Design | $2,500,000 |
| 24 | Ross & Baruzzini | $2,404,599 |
| 25 | Newcomb & Boyd | $2,166,918 |
| 26 | Sparling | $2,151,181 |
| 27 | KPFF Consulting Engineers | $2,000,000 |
| 27 | Rolf Jensen & Associates | $2,000,000 |
| 29 | Smith Seckman Reid | $1,273,546 |
| 30 | Bridgers & Paxton Consulting Engineers | $1,098,183 |
| 31 | Vanderweil Engineers | $1,078,000 |
| 32 | Heapy Engineering | $1,071,676 |
| 33 | TTG | $1,050,980 |
| 34 | CCRD Partners | $1,000,000 |
| 35 | Davis, Bowen & Friedel | $816,200 |
| 36 | Henderson Engineers | $779,884 |
| 37 | M-E Engineers | $750,000 |
| 38 | Interface Engineering | $572,371 |
| 39 | GRW | $487,940 |
| 40 | Spectrum Engineers | $436,740 |
| 41 | Aon Fire Protection Engineering | $400,000 |
| 41 | Paulus, Sokolowski and Sartor | $400,000 |
| 43 | Peter Basso Associates | $300,000 |
| 44 | Syska Hennessy Group | $278,129 |
| 45 | GRAEF | $259,738 |
| 46 | Apogee Consulting Group | $251,000 |
| 47 | KJWW Engineering Consultants | $242,970 |
| 48 | Simpson Gumpertz & Heger | $200,000 |
| 49 | H.F. Lenz | $180,000 |
| 50 | SSOE Group | $146,989 |
| 51 | Glumac | $128,000 |
| 52 | CTLGroup | $100,000 |
| 52 | Dunham Associates | $100,000 |
| 52 | Rist-Frost-Shumway Engineering | $100,000 |
| 55 | Total Building Commissioning | $71,349 |
| 56 | Walter P Moore | $29,068 |
| 57 | Brinjac Engineering | $16,166 |
| 58 | Environmental Systems Design | $10,000 |
| 59 | Shive-Hattery | $3,071 |
| 60 | CJL Engineering | $3,000 |
Top Military Sector Construction Firms
| Rank | Company | 2012 Military Revenue ($) |
| 1 | Balfour Beatty | $835,493,608 |
| 2 | Hensel Phelps | $705,861,979 |
| 3 | B. L. Harbert International | $504,804,208 |
| 4 | Clark Group | $459,441,089 |
| 5 | Lend Lease | $448,232,000 |
| 6 | ECC | $404,881,855 |
| 7 | JE Dunn Construction | $383,882,914 |
| 8 | Gilbane | $343,600,000 |
| 9 | Walsh Group, The | $312,117,849 |
| 10 | Manhattan Construction | $200,119,000 |
| 11 | Weitz Co., The | $190,000,000 |
| 12 | McCarthy Holdings | $182,000,000 |
| 13 | Whiting-Turner Contracting Co., The | $173,204,860 |
| 14 | Turner Corporation, The | $163,707,000 |
| 15 | Hunt Companies | $159,295,120 |
| 16 | Mortenson Construction | $141,767,000 |
| 17 | Swinerton Builders | $128,767,700 |
| 18 | Walbridge | $113,929,436 |
| 19 | Sundt Construction | $88,800,392 |
| 20 | CORE Construction Group | $82,025,741 |
| 21 | W. M. Jordan Co. | $72,506,220 |
| 22 | Yates Cos., The | $69,400,000 |
| 23 | Jones Lang LaSalle | $60,287,223 |
| 24 | Absher Construction | $55,810,000 |
| 25 | Haskell | $52,656,368 |
| 26 | Consigli Construction | $49,230,541 |
| 27 | Messer Construction | $33,725,402 |
| 28 | Skanska USA | $33,600,000 |
| 29 | Harkins Builders | $30,500,000 |
| 30 | Brasfield & Gorrie | $29,147,688 |
| 31 | Hunt Construction Group | $29,000,000 |
| 32 | Suffolk Construction | $28,999,924 |
| 33 | Barton Malow | $25,600,015 |
| 34 | PCL Construction Enterprises | $19,907,096 |
| 35 | Coakley & Williams Construction | $16,555,554 |
| 36 | New South Construction | $13,300,000 |
| 37 | S. M. Wilson & Co. | $9,637,564 |
| 38 | Hoffman Construction | $7,820,967 |
| 39 | C.W. Driver | $6,896,321 |
| 40 | Choate Construction | $4,921,619 |
| 41 | Robins & Morton | $4,200,000 |
| 42 | Bomel Construction | $2,400,000 |
| 43 | Flintco | $1,400,000 |
| 44 | KBE Building Corporation | $1,229,621 |
| 45 | Doster Construction | $1,124,889 |
| 46 | Hoar Construction | $1,101,000 |
| 47 | Graycor | $571,323 |
| 48 | Power Construction | $200,000 |
| 49 | Tutor Perini Corporation | $188,000 |
| 50 | Alberici Constructors | $100,186 |
| 51 | DPR Construction | $86,891 |
| 52 | E.W. Howell | $85,000 |
Read the full 2013 Giants 300 Report
Related Stories
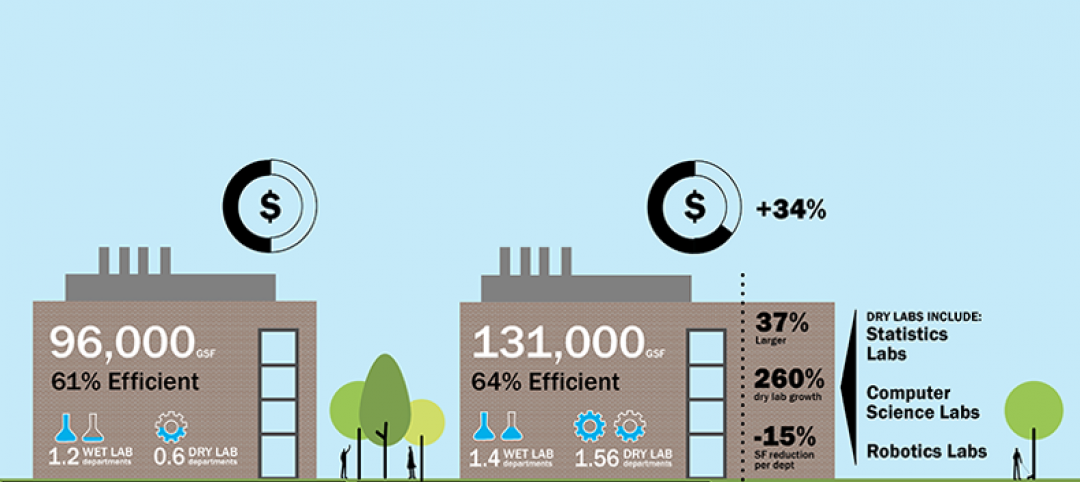
Laboratories | Aug 3, 2017
Today’s university lab building by the numbers
A three-month study of science facilities conducted by Shepley Bulfinch reveals key findings related to space allocation, size, and cost.
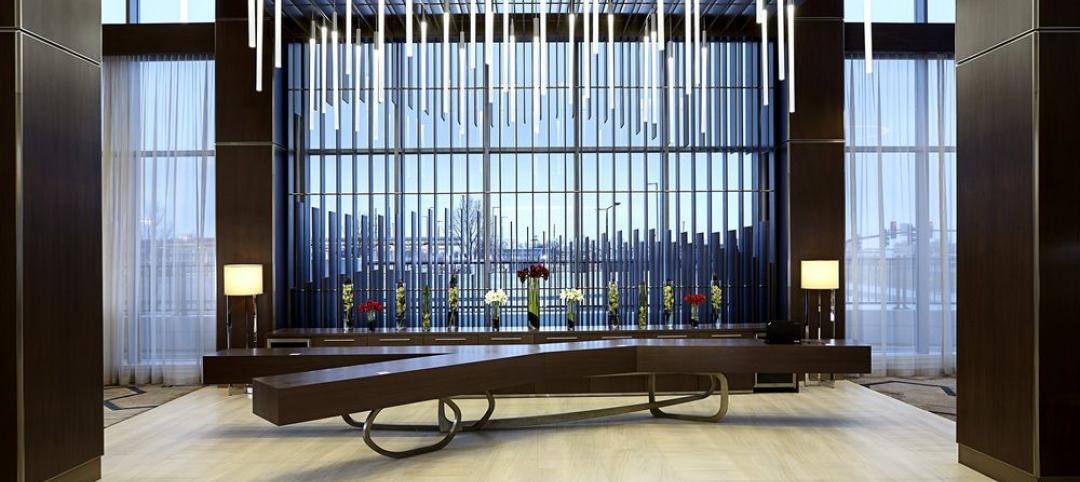
Lighting | Aug 2, 2017
Dynamic white lighting mimics daylighting
By varying an LED luminaire’s color temperature, it is possible to mimic daylighting, to some extent, and the natural circadian rhythms that accompany it, writes DLR Group’s Sean Avery.

Healthcare Facilities | Aug 2, 2017
8 healthcare design lessons from shadowing a nurse
From the surprising number of “hunting and gathering” trips to the need for quiet spaces for phone calls, interior designer Carolyn Fleetwood Blake shares her takeaways from a day shadowing a nurse.

Multifamily Housing | Jul 27, 2017
Apartment market index: Business conditions soften, but still solid
Despite some softness at the high end of the apartment market, demand for apartments will continue to be substantial for years to come, according to the National Multifamily Housing Council.
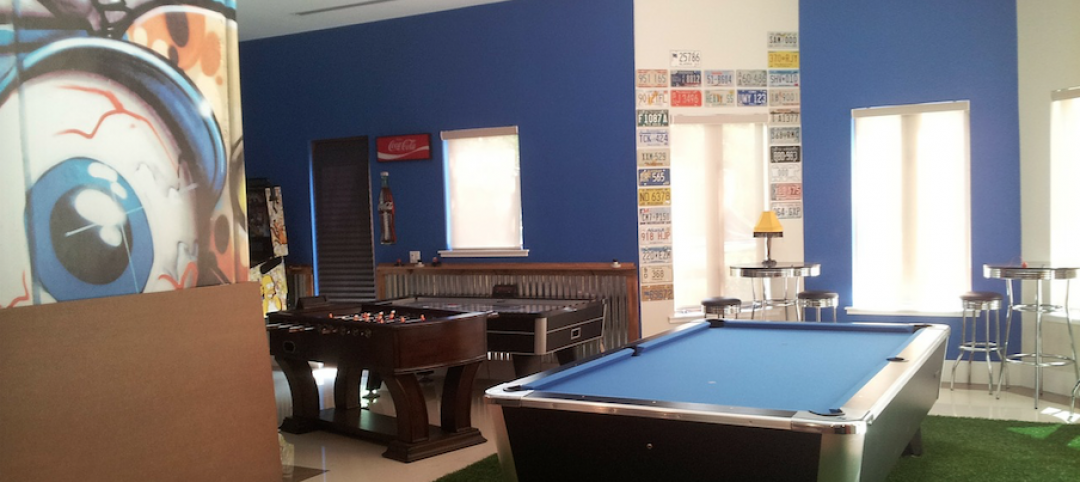
Multifamily Housing | Jul 27, 2017
Game rooms and game simulators popular amenities in multifamily developments
The number of developments providing space for physical therapy was somewhat surprising, according to a new survey.
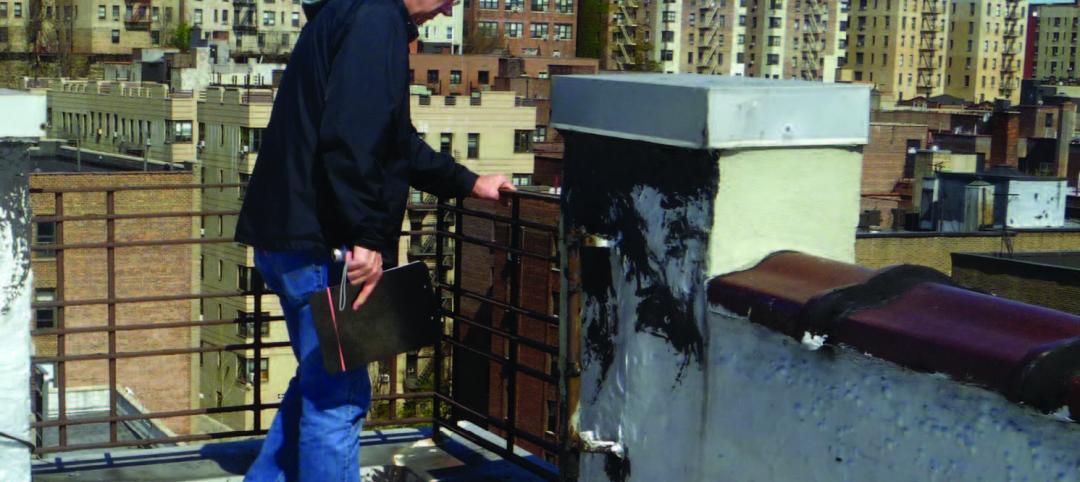
Building Enclosure Systems | Jul 26, 2017
Balcony and roof railings and the code: Maintain, repair, or replace? [AIA course]
Lacking familiarity with current requirements, some owners or managers complete a roof or balcony rehabilitation, only to learn after the fact that they need to tear noncompliant railings out of their new roof or terrace and install new ones.

Multifamily Housing | Jul 12, 2017
Midyear Rent Report: 26 states saw rental price increases in first half of 2017
The most notable rental increases are in growing markets in the South and Southwest: New Orleans, Glendale, Ariz., Houston, Reno, N.V., and Atlanta.

Multifamily Housing | Jul 12, 2017
7 noteworthy multifamily projects: posh amenities, healthy living, plugged-in lifestyle
Zen meditation gardens, bocce courts, saltwater pools, and free drinks highlight the niceties at these new multifamily developments.
Accelerate Live! | Jul 6, 2017
Watch all 20 Accelerate Live! talks on demand
BD+C’s inaugural AEC innovation conference, Accelerate Live! (May 11, Chicago), featured talks on machine learning, AI, gaming in construction, maker culture, and health-generating buildings.
Building Team | Jun 22, 2017
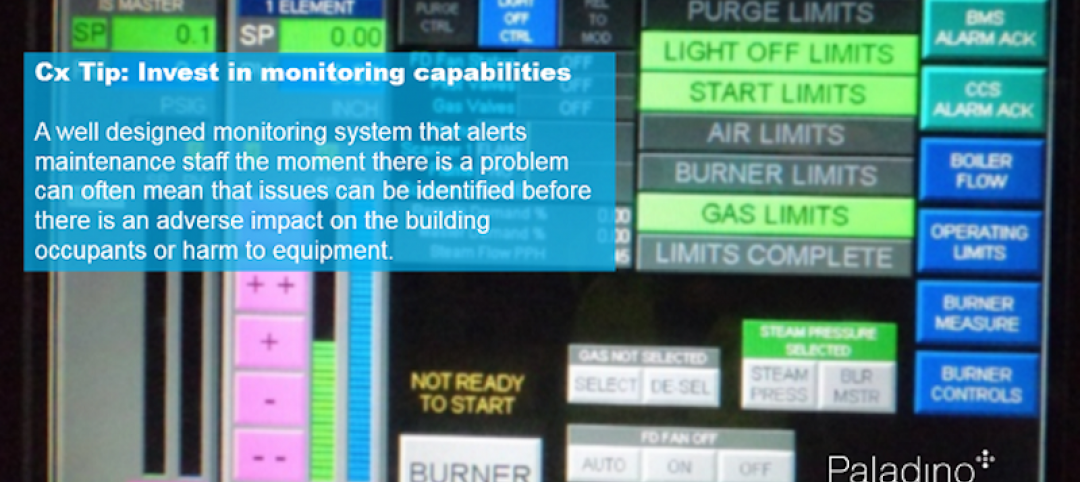
Seven lessons learned on commissioning projects
Commissioning is where the rubber meets the road in terms of building design.


