


Despite looming economic concerns and nearing the tail end of an extended growth cycle, the nonresidential buildings industry continues to march ahead with no major slowdown in sight, according to a panel of economists.
The AIA Consensus Construction Forecast—which consists of economic forecasts from Associated Builders and Contractors, ConstructConnect, Dodge Data & Analytics, FMI, IHS Economics, Moody’s, and Wells Fargo Securities—is projecting 4.7% growth in nonresidential construction spending in 2018 and a 4.0% rise in 2019. Both forecasts are up from the panel’s initial estimate (4.0% and 3.9%) at the beginning of the year.
“At the halfway point of the year, this panel is even more optimistic,” said Kermit Baker, PhD, Hon. AIA, Chief Economist at the American Institute of Architects. “If these projections materialize, by the end of next year the industry will have seen nine years of consecutive growth, and total spending on nonresidential buildings will be 5% greater—ignoring inflationary adjustments—than the last market peak
of 2008.”
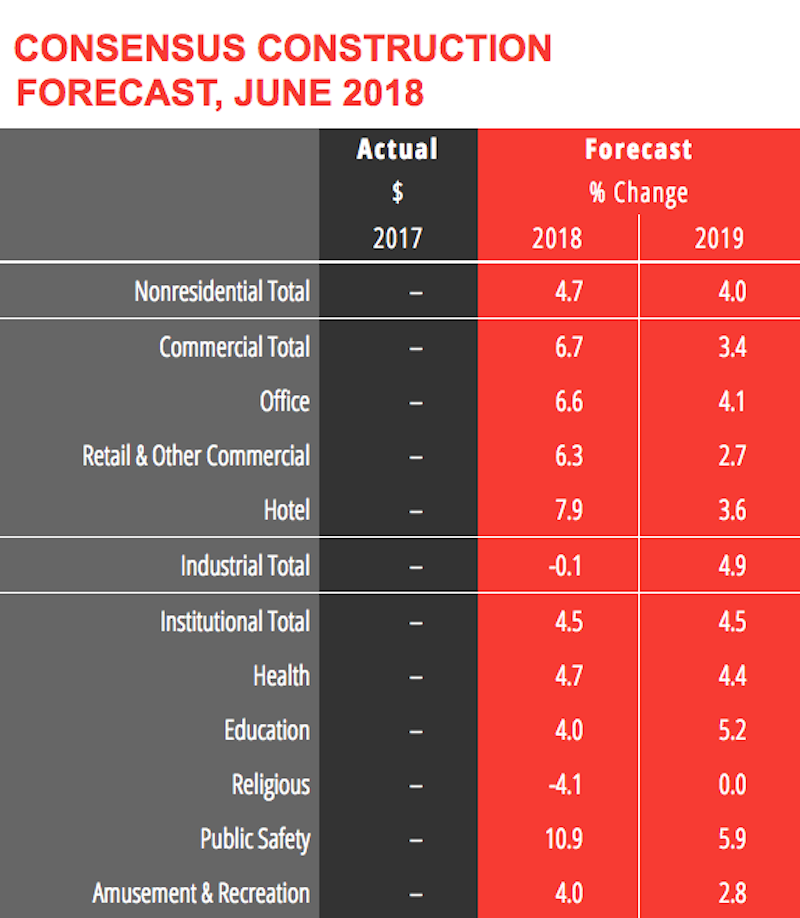 At the midpoint of the year, the AIA Consensus Construction Forecast Panel upgraded its 2018 and 2019 outlook for the nonresidential construction industry.
Baker and the other economists point to several bright spots for the market:
• The commercial sector continues to overperform. With numbers strong through the first half of the year, the consensus is that spending on commercial buildings will increase 6.7% this year (up from 4.4% projected at the beginning of the year), and 3.4% next year (up from 2.9%).
• More optimism surrounding institutional building activity, with a modest uptick in the forecast.
• Growing workloads at architecture firms. Firms saw healthy growth in both ongoing billings and new project activity last year, and the pace of gains for both of these indicators has remained strong through the first half of 2018.
• Business confidence levels are at their highest scores since 2004. Businesses are generally seeing a more accommodative regulatory environment, and have seen healthy growth in corporate profits.
• Consumer sentiment scores are at their highest level since 2000. The economy is on pace to add almost 2.6 million net new payroll positions this year, exceeding the 2.2 million that were added in 2017.
Related Stories

Market Data | Jul 31, 2019
For the second quarter of 2019, the U.S. hotel construction pipeline continued its year-over-year growth spurt
The growth spurt continued even as business investment declined for the first time since 2016.

Market Data | Jul 23, 2019
Despite signals of impending declines, continued growth in nonresidential construction is expected through 2020
AIA’s latest Consensus Construction Forecast predicts growth.

Market Data | Jul 20, 2019
Construction costs continued to rise in second quarter
Labor availability is a big factor in that inflation, according to Rider Levett Bucknall report.

Market Data | Jul 18, 2019
Construction contractors remain confident as summer begins
Contractors were slightly less upbeat regarding profit margins and staffing levels compared to April.

Market Data | Jul 17, 2019
Design services demand stalled in June
Project inquiry gains hit a 10-year low.

Market Data | Jul 16, 2019
ABC’s Construction Backlog Indicator increases modestly in May
The Construction Backlog Indicator expanded to 8.9 months in May 2019.

K-12 Schools | Jul 15, 2019
Summer assignments: 2019 K-12 school construction costs
Using RSMeans data from Gordian, here are the most recent costs per square foot for K-12 school buildings in 10 cities across the U.S.

Market Data | Jul 12, 2019
Construction input prices plummet in June
This is the first time in nearly three years that input prices have fallen on a year-over-year basis.

Market Data | Jul 1, 2019
Nonresidential construction spending slips modestly in May
Among the 16 nonresidential construction spending categories tracked by the Census Bureau, five experienced increases in monthly spending.

Market Data | Jul 1, 2019
Almost 60% of the U.S. construction project pipeline value is concentrated in 10 major states
With a total of 1,302 projects worth $524.6 billion, California has both the largest number and value of projects in the U.S. construction project pipeline.


