


Construction employment increased in nearly two out of three U.S. metro areas in 2021, according to an analysis by the Associated General Contractors of America of new government employment data. Yet association officials noted that labor shortages likely kept many firms from adding even more workers.
“Construction employment topped year-earlier levels in almost two-thirds of metros for the past few months,” said Ken Simonson, the association’s chief economist. “But contractors in many areas say they would have hired even more workers if qualified candidates were available.”
Job openings in construction totaled 273,000 at the end of December, an increase of 62,000 or nearly 30% from December 2020, according to the government’s latest Job Openings and Labor Turnover Survey. That figure exceeded the 220,000 employees that construction firms were able to hire in December, implying firms would have added over twice as many workers if they had been able to fill all openings, Simonson pointed out.
Construction employment rose in 231 or 65% of 358 metro areas in 2021. Houston-The Woodlands-Sugar Land, Texas added the most construction jobs (8,800 jobs, 4%), followed by Chicago-Naperville-Arlington Heights, Ill. (6,500 jobs, 5%) and Los Angeles-Long Beach-Glendale, Calif. (6,300 jobs, 4%). Sioux Falls, S.D. had the highest percentage gain (24%, 2,100 jobs), followed by Beaumont-Port Arthur, Texas (18%, 3,000 jobs) and Atlantic City-Hammonton, N.J. (18%, 900 jobs).
Construction employment declined from a year earlier in 76 metros and was flat in 51. Nassau County-Suffolk County, N.Y. lost the most jobs (-5,700 or -7%), followed by New York City (-4,200 jobs, -3%) and Baltimore-Columbia-Towson, Md. (-3,800 jobs, -5%). The largest percentage declines were in Evansville, Ind.-Ky. (-18%, -1,700 jobs); Napa, Calif. (-15%, -600 jobs); Anchorage, Alaska (-14%, -1,400 jobs); and Lewiston, Idaho-Wash. (-13%, -200 jobs). Seven areas set all-time lows for December, while 57 metros reached new December highs for construction jobs.
Association officials said that the growing number of job openings in the industry was a clear sign that labor shortages are getting worse. They noted that the association’s recently released 2022 Construction Hiring and Business Outlook found that 83% of contractors report having a hard time finding qualified workers to hire. They urged Congress and the Biden administration to boost funding for career and technical education to help recruit and prepare more people for high-paying construction careers.
“For every dollar the federal government currently invests in career and technical education, it spends six urging students to attend college and work in an office,” said Stephen E. Sandherr, the association’s chief executive officer. “Narrowing that funding gap will help more people understand that there are multiple paths to success.”
View the metro employment data, rankings, top 10, and new highs and lows.
Related Stories

Market Data | May 20, 2020
6 must reads for the AEC industry today: May 20, 2020
A wave 'inside' a South Korean building and architecture billings continues historic contraction.

Market Data | May 20, 2020
Architecture billings continue historic contraction
AIA’s Architecture Billings Index (ABI) score of 29.5 for April reflects a decrease in design services provided by U.S. architecture firms.

Market Data | May 19, 2020
5 must reads for the AEC industry today: May 19, 2020
Clemson's new mass timber building and empty hotels as an answer for the affordable housing shortage.

Market Data | May 18, 2020
5 must reads for the AEC industry today: May 18, 2020
California's grid can support all-electric buildings and you'll miss your office when it's gone.

Market Data | May 15, 2020
6 must reads for the AEC industry today: May 15, 2020
Nonresidential construction employment sees record loss and Twitter will keep all of its office space.
Market Data | May 15, 2020
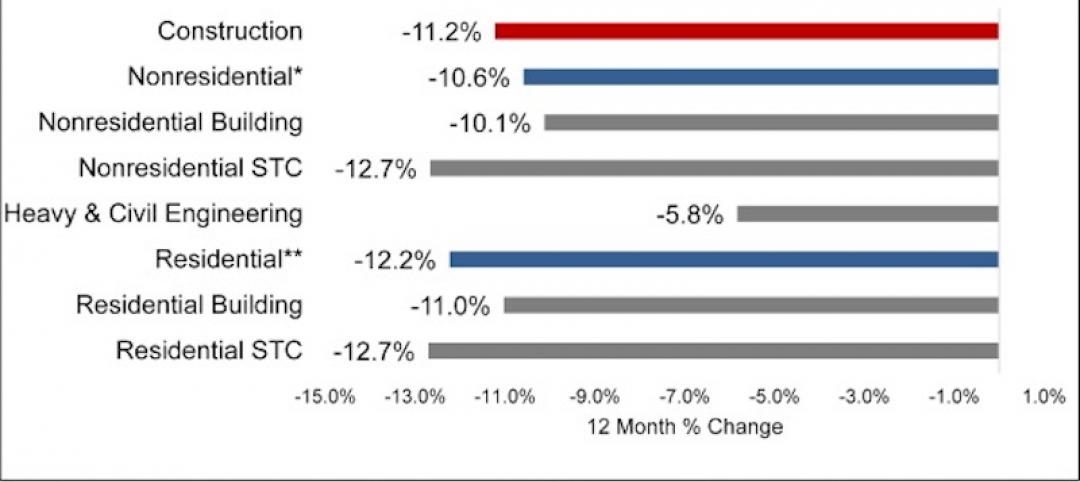
Nonresidential construction employment sees record loss in April
The construction unemployment rate was 16.6% in April, up 11.9 percentage points from the same time last year.

Market Data | May 14, 2020
5 must reads for the AEC industry today: May 14, 2020
The good news about rent might not be so good and some hotel developers consider whether to abandon projects.

Market Data | May 13, 2020
House democrats' coronavirus measure provides some relief for contractors, but lacks other steps needed to help construction
Construction official says new highway funding, employee retention credits and pension relief will help, but lack of safe harbor measure, Eextension of unemployment bonus will undermine recovery.

Market Data | May 13, 2020
5 must reads for the AEC industry today: May 13, 2020
How to design resilient libraries in a post-covid world and vacation real-estate markets are 'toast.'
Market Data | May 12, 2020
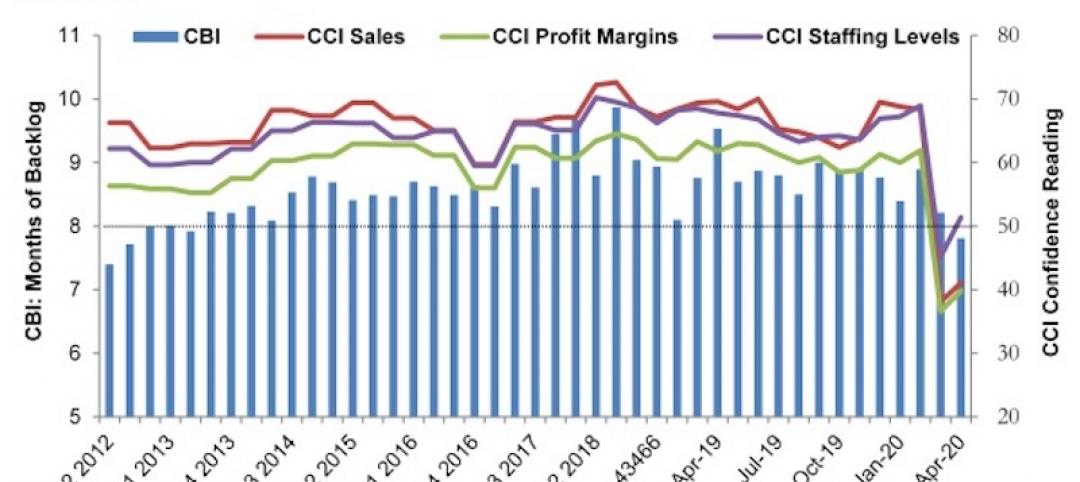
ABC’s Construction Backlog Indicator falls in April; Contractor Confidence rebounds from historic lows
Nonresidential construction backlog is down 0.4 months compared to the March 2020 ABC survey and 1.7 months from April 2019.


