


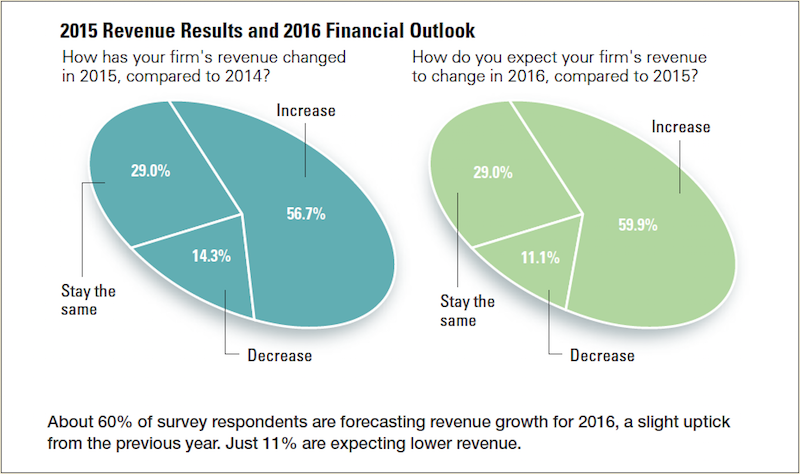
Despite facing a litany of market impediments—the still-sluggish economy, construction labor shortages, the slow-to-recover education and healthcare markets—the majority of AEC firms saw revenues grow in 2015, and an even greater number expect earnings to rise in 2016, according to a survey of 337 AEC professionals by Building Design+Construction.
Nearly six out of 10 survey respondents (56.7%) indicated that revenues had increased at their firms in 2015, and 59.9% expect income from nonresidential building work to rise this year. This represents a slight uptick from 2014’s survey, when 54.4% reported higher revenue for the year.
About half of the respondents (45.7%) rated their firm’s 2015 business year as either “excellent” or “very good,” and just 2.1% said it was a “poor” year. Looking to 2016, 52.7% believe it will be “excellent” or “very good” from a revenue standpoint. Nearly three-quarters (71.4%) rated the overall health of their firm either “very good” or “good.”
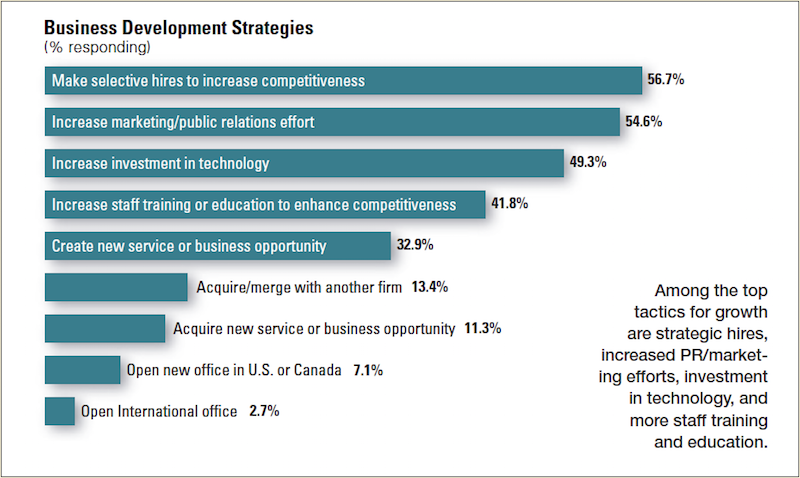
Asked to rate their firm’s top business development tactics for 2016, strategic hiring (56.7% rated it as a top tactic for growth), marketing/public relations (54.6%), and technology upgrades (49.3%) topped the list. Other popular growth strategies include staff training/education (41.8%), a new service/business opportunity (32.9%), and a firm merger/acquisition (13.4%).
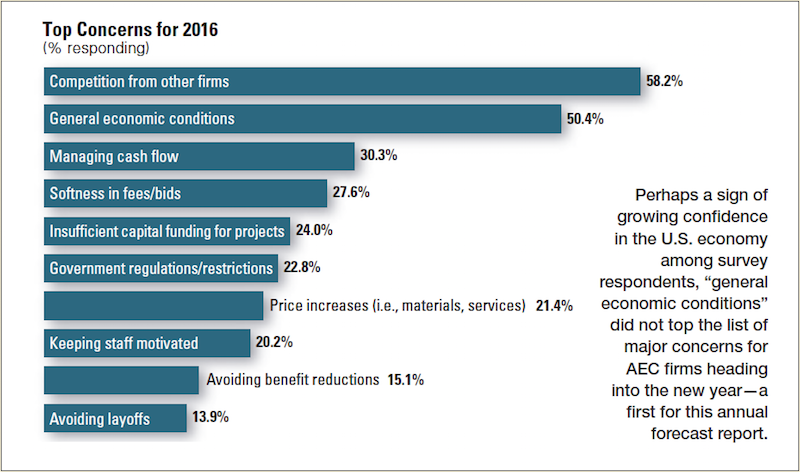
Among the top concerns for AEC firms are competition from other firms (58.2% ranked it as a top-three concern), general economic conditions (50.4%), managing cash flow (30.3%), and softness in fees/bids (27.6%).
HEALTHCARE SECTOR starting to REBOUND
Respondents were asked to rate their firms’ prospects in specific construction sectors on a five-point scale from “excellent” to “very weak.” Among the findings:
The multifamily boom continues, as the Millennials and Baby Boomers gravitate to rental housing and an urban lifestyle. Multifamily ranked as the most active sector, with 69.7% of respondents rating it in the good/excellent category, up from 62.3% last year and 56.1% in 2013.
The healthcare market is starting to stabilize and grow, as hospitals and healthcare providers adjust to the post-Affordable Care Act world. The sector ranked as the second most active; 68.0% gave it a good/excellent rating, up from 63.6% in 2014 and 62.5% the previous year.
Other active sectors include senior/assisted living (63.1% rated it in the good/excellent category), office interiors/fitouts (62.4%), data centers/mission critical (59.3%), higher education (48.6%), industrial/warehouse (46.7%), retail (44.9%), and government/military (42.5%).
Respondents to the BD+C survey include architect/designers (52.2%), engineers (19.6%), contractors (18.4%), consultants (5.0%), owner/developers (1.2%), and facility managers (1.0%).
BIM/VDC TAKES HOLD
The adoption of building information modeling and virtual design and construction tools and processes continues to grow in the AEC marketplace. More than eight in 10 respondents (82.1%) said their firm uses BIM/VDC tools on at least some of its projects, up from 80.0% in 2014 and 77.3% in 2013. About a fifth (20.3%) said their firm uses BIM/VDC on more than 75% of projects, up from 17.3% last year and 12.2% in 2013.
Respondents to the BD+C survey include architect/designers (52.2%), engineers (19.6%), contractors (18.4%), consultants (5.0%), owner/developers (1.2%), and facility managers (1.0%).
Related Stories

Market Data | Jan 24, 2018
HomeUnion names the most and least affordable rental housing markets
Chicago tops the list as the most affordable U.S. metro, while Oakland, Calif., is the most expensive rental market.

Market Data | Jan 12, 2018
Construction input prices inch down in December, Up YOY despite low inflation
Energy prices have been more volatile lately.

Market Data | Jan 4, 2018
Nonresidential construction spending ticks higher in November, down year-over-year
Despite the month-over-month expansion, nonresidential spending fell 1.3 percent from November 2016.

Contractors | Jan 4, 2018
Construction spending in a ‘mature’ period of incremental growth
Labor shortages are spiking wages. Materials costs are rising, too.
 reported the November ABI score was 55.0, up from a score of 51.7 in the previous month. Photo: Pixabay")
Market Data | Dec 20, 2017
Architecture billings upturn shows broad strength
The American Institute of Architects (AIA) reported the November ABI score was 55.0, up from a score of 51.7 in the previous month.

Market Data | Dec 14, 2017
ABC chief economist predicts stable 2018 construction economy
There are risks to the 2018 outlook as a number of potential cost increases could come into play.

Market Data | Dec 13, 2017
Top world regions and markets in the global hotel construction pipeline
The top world region by project count is North America.

Market Data | Dec 11, 2017
Global hotel construction pipeline is growing
The Total Pipeline stands at 12,427 Projects/2,084,940 Rooms.

Market Data | Dec 11, 2017
Construction backlog surges, sets record in third quarter
CBI is a leading economic indicator that reflects the amount of construction work under contract, but not yet completed.

Market Data | Dec 7, 2017
Buoyed by healthy economy, ABC Index finds contractors upbeat
Despite rising construction labor and materials costs, 55% of contractors expect their profit margins to expand in the first half of 2018.


