


Two years ago, voters in South Carolina’s Berkeley County School District, which serves nearly 31,000 students in an area just north of Charleston, passed a $198 million bond referendum targeted at building five new schools, completing major renovations to four existing schools, and performing minor renovations on more than 20 others.
With the passage of the referendum, school district officials soon realized that one of the most important components in their building program would be the choice of HVAC system for the schools. In the hot, humid climate of South Carolina, an efficient, cost-effective HVAC system would be required to ensure a productive and comfortable learning environment, as well as to control energy costs.
The school district’s most recently completed new school used a four-pipe (chilled and heating water), fan coil unit system with ice storage. However, with South Carolina’s adoption of the 2012 International Code Council building codes and 2009 ICC Energy Code in January 2013, such an HVAC configuration (specifically the changes in dehumidification control allowed by ASHRAE Standard 90.1-2007 for Zone 3a) would no longer meet code.
At that point our firm, RMF Engineering, approached Berkeley County SD and suggested that a life cycle cost analysis, or LCCA, be completed in order to determine the best HVAC system based upon data specific to the district and the architectural design of its future building projects.
Before describing the results of this study, let’s take a look at the prescriptive process, obstacles, and lessons learned by our team in the course of preparing the LCCA.
KEY COMPONENTS OF AN HVAC LCCA
There are two main components to an HVAC LCCA: annual energy use and total project cost.
Annual energy use is best determined by creating whole building energy models. Project cost accounts for all of the HVAC construction, maintenance, and energy costs for the systems being evaluated. These costs are calculated over a period of time, usually 20-30 years, and then converted to a net present value.
ALSO SEE: 8 Do's and Don'ts for Completing an HVAC Life Cycle Cost Assessment
There are many hurdles to overcome when completing a life cycle cost assessment. RMF Engineering’s Seth Spangler offers some words of advice regarding LCCAs, based on his firm's experience on the Berkeley County School District HVAC study. Read the article.
Before developing an analysis, our team had to determine which building components were fixed––in this case, the building architecture––and which could be variable––here, the HVAC system. This simplified the analysis greatly.
Once the static components for the analysis were defined, we created energy models using eQUEST whole building energy analysis software to analyze the energy consumption of the proposed HVAC systems. The final result of the modeling—i.e., annual energy usage by utility and component—was used to determine the annual HVAC energy usage.
The selection of candidate HVAC systems started with evaluating systems the district was already using in its schools as well as new systems that might be used. Candidate systems also had to be able to provide individual control of the learning environment. This required that each classroom have its own terminal unit––a crucial factor in terms of temperature control, noise, and student and teacher comfort.
Certain HVAC systems were eliminated because the district did not have any similar systems in place and the maintenance staff was unfamiliar with their operation and maintenance. Other systems were omitted from consideration because they had a record of underperforming or were costly to maintain. Ultimately, the district charged our firm with assessing four HVAC systems.
To perform the assessment, we created a baseline model defined by several fixed parameters. Let’s examine these more closely.
Weather data and design conditions. The typical meteorological year weather file for Charleston was used to simulate the 8,760 annual hours of outdoor conditions. The equipment design capacity was sized based on ASHRAE Handbook of Fundamentals cooling design values using 1% annual cumulative frequency of occurrence. Heating values were based on 99% annual cumulative frequency of occurrence for the location.

Building geometry and thermal envelope were modeled based on a prototype school that was similar to many of the existing buildings within the school district. The geometry, wall, roof, floor, and glazing were all modeled based on the architectural design documents.
Schedules. HVAC, lighting, equipment, and occupancy schedules were modeled to be as close to actual school operation schedules as possible. The HVAC systems were modeled for 8,760 hours a year, based on the school calendar (Monday to Friday only); the bell schedule was used to create an hourly occupancy schedule. All holidays, breaks, and weekends were modeled to be unoccupied. It was anticipated that the school would also be partially occupied during the summer.
Indoor design temperature conditions were modeled after the district’s standards: 75°F in the cooling mode, 70°F in the heating mode, with a range of ±2°F. Indoor design humidity conditions in the cooling mode were modeled to be 50% relative humidity, ±5%. The fan coil units were modeled to satisfy the space temperature set points, while the dedicated outdoor air units were modeled to provide neutral supply air and satisfy the building humidity set point. Building controls and various energy recovery and energy-savings strategies were also modeled. This information was gathered from the mechanical design documents.
Internal loads––including the building occupant load (both sensible and latent), plug load (such as heat from lights and computers), and lighting load––were modeled to be consistent with the operation of the planned new building. Lighting power density was modeled based on the ASHRAE 90.1 Whole Building method, which specifies a maximum LPD of 1.2 W/sf for K-12 schools. This information was gathered from the ASHRAE Handbook of Fundamentals and ASHRAE 90.1-2007.
Based on these parameters, we created energy models comparing the following four HVAC systems:
1. A four-pipe fan coil system with a decoupled four-pipe outdoor air system, air-cooled chillers with ice storage to generate chilled water, and gas-fired condensing boilers to generate heating water.
2. The same configuration as above without ice storage to generate chilled water.
3. A four-pipe fan coil system with a decoupled four-pipe outdoor air system, a magnetically levitated bearing centrifugal chiller (with a high-efficiency compressor) without ice storage to generate chilled water, and gas-fired condensing boilers to generate heating water.
4. A water-source heat pump fan coil system with a decoupled water-source outdoor air system, a closed-circuit cooling tower, and gas-fired condensing boilers to generate condenser water.
COMPARING THE COSTS OF THE FOUR HVAC OPTIONS
The second part of the analysis involved determining all of the costs associated with the proposed HVAC system––first costs, annual maintenance cost, energy costs, and escalation and discount rates.
Capital project costs were calculated by determining the equipment, materials, and installation costs, plus an additional 25% of the construction cost to account for soft costs. All of the cost data for the equipment was provided by the basis of design HVAC manufacturer. The controls contractor provided a budget quote for each of the HVAC systems based on the school’s square footage. Piping, supports, and other miscellaneous equipment costs were provided by the manufacturer or collected from RSMeans. Cost-neutral items, such as ductwork and duct insulation, were not included.
Annual maintenance cost. Berkeley County School District prefers to perform its own maintenance, so BCSD facilities personnel evaluated each of the proposed HVAC systems and defined their maintenance strategies, schedules, and cost for each system type.
Annual energy cost. The energy models were used to calculate the annual energy usage. Only energy usage for the HVAC systems and their associated components was used for the analysis. Items affecting the HVAC system, such as lighting and process loads, were modeled; however, their energy consumption was metered separately in the energy model so that the analysis could evaluate the energy usage of the HVAC system alone. The utility rate structure was then applied to the annual energy usage to find the annual HVAC energy cost.
Escalation and discount rate. Electrical costs were calculated based on a 4% escalation rate provided by the local utility company. Natural gas and maintenance costs were calculated based on a 2% escalation rate. The escalation rates were used in conjunction with a discount factor of 5% in order to calculate the net present value of the annual costs.
The final step in the analysis was to determine what period of time would be used for the calculations. While most school buildings could be expected to have a lifetime of 30, 40, or even 50 years, such was not the case for the mechanical systems under study. Three of the systems had published life cycles of 20 years; the water-source heat pump system had a published effective life of 15 years. To rectify this imbalance, it was decided to calculate the cost over a 20-year period, with the assumption that 33% of the water-source heat pump system would have to be replaced at year 15.
All of the costs were then added together and the net present value of each system was calculated based on a 20-year period. The results were then analyzed by comparing the capital cost, the first-year cost, and the life cycle cost (Table 1).
For the modeled building architecture, we determined that a water-source heat pump system would have the lowest annual energy usage––at least 44.3% (MBtu) less than any of the other three systems we modeled. It also had the lowest 20-year life cycle cost: 19.6% less than the FCU with ice storage, 13.8% less than the FCU without ice storage, and 13.1% less than the FCU with high-efficiency chiller.
Moreover, our analysis also showed that the water-source heat pump system would also have the lowest maintenance costs, the greatest ease of maintenance, and the least amount of disruption for repairs of any of the candidate systems.
The net cost of this study to the school district, minus the funding from the utility cooperative, was $24,000. The analysis showed that the school district had the potential to save almost $700,000 over the next-best-performing system and more than a million dollars over the worst-performing system—for each new school project of similar size.
Based on the energy model, the life cycle cost analysis, the ease of use, and the classroom environment factors cited above, our firm was quite confident in recommending the water-source heat pump system to our client––a recommendation Berkeley County School District officials readily accepted. The system has been specified for the new elementary school that was the prototype for the study and will be used in all of the new schools and most of the major renovation projects.
A life cycle cost analysis is only as good as its inputs. However, with the right team, the right information, and an unbiased analysis, an LCCA can yield extremely valuable results. Every project client, whether large or small, is concerned about energy use and building cost, so a life cycle cost analysis can be useful on virtually any project, no matter the size.
About the Author
Seth Spangler (seth.spangler@rmf.com) is a mechanical engineer at RMF Engineering, Charleston, S.C., with experience in the design and analysis of mechanical systems serving academic, healthcare, laboratory, and federal projects. His expertise includes energy auditing, energy modeling, and the implementation of LEED design and construction credits.
Related Stories
| Apr 14, 2011
USGBC debuts LEED for Healthcare
The U.S. Green Building Council (USGBC) introduces its latest green building rating system, LEED for Healthcare. The rating system guides the design and construction of both new buildings and major renovations of existing buildings, and can be applied to inpatient, outpatient and licensed long-term care facilities, medical offices, assisted living facilities and medical education and research centers.
| Apr 13, 2011
National Roofing Contractors Association revises R-value of polyisocyanurate (ISO) insulation
NRCA has updated their R-value recommendation for polyisocyanurate roof insulation with the publication of the 2011 The NRCA Roofing Manual: Membrane Roof Systems.

| Apr 13, 2011
Professor Edward Glaeser, PhD, on how cities are mankind’s greatest invention
Edward Glaeser, PhD, the Fred and Eleanor Glimp Professor of Economics at Harvard University and director of the Taubman Center for State and Local Government and the Rappaport Institute for Greater Boston, as well as the author of Triumph of the City: How Our Greatest Invention Makes Us Richer, Smarter, Healthier, and Happier, on how cities are mankind’s greatest invention.
| Apr 13, 2011
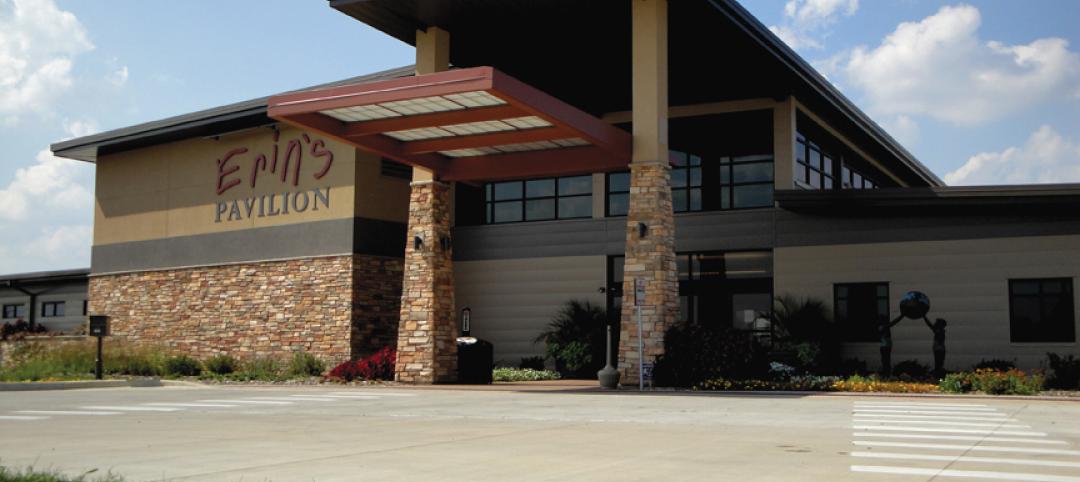
Southern Illinois park pavilion earns LEED Platinum
Erin’s Pavilion, a welcome and visitors center at the 80-acre Edwin Watts Southwind Park in Springfield, Ill., earned LEED Platinum. The new 16,000-sf facility, a joint project between local firm Walton and Associates Architects and the sustainability consulting firm Vertegy, based in St. Louis, serves as a community center and special needs education center, and is named for Erin Elzea, who struggled with disabilities during her life.

| Apr 13, 2011
Virginia hospital’s prescription for green construction: LEED Gold
Rockingham Memorial Hospital in Harrisonburg, Va., is the commonwealth’s first inpatient healthcare facility to earn LEED Gold. The 630,000-sf facility was designed by Earl Swensson Associates, with commissioning consultant SSRCx, both of Nashville.

| Apr 13, 2011
Office interaction was the critical element to Boston buildout
Margulies Perruzzi Architects, Boston, designed the new 11,460-sf offices for consultant Interaction Associates and its nonprofit sister organization, The Interaction Institute for Social Change, inside an old warehouse near Boston’s Seaport Center.

| Apr 13, 2011
Expanded Museum of the Moving Image provides a treat for the eyes
The expansion and renovation of the Museum of the Moving Image in the Astoria section of Queens, N.Y., involved a complete redesign of its first floor and the construction of a three-story 47,000-sf addition.

| Apr 13, 2011
Duke University parking garage driven to LEED certification
People parking their cars inside the new Research Drive garage at Duke University are making history—they’re utilizing the country’s first freestanding LEED-certified parking structure.

| Apr 13, 2011
Red Bull Canada HQ a mix of fluid spaces and high-energy design
The Toronto architecture firm Johnson Chou likes to put a twist on its pared-down interiors, and its work on the headquarters for Red Bull Canada is no exception. The energy drink maker occupies 12,300 sf on the top two floors of a three-story industrial building in Toronto, and the design strategy for its space called for leaving the base building virtually untouched while attention was turned to the interior architecture.

| Apr 13, 2011
Former department store gets new lease on life as MaineHealth HQ
The long-vacant Sears Roebuck building in Portland, Maine, was redeveloped into the corporate headquarters for MaineHealth. Consigli Construction and local firm Harriman Architects + Engineers handled the 14-month fast-track project, transforming the 89,000-sf, four-story facility for just $100/sf.


