


In the third quarter of 2018, analysts at Lodging Econometrics (LE) report that the top five markets with the largest total hotel construction pipelines are: New York City with 170 projects/29,630 rooms; Dallas with 157 projects/18,954 rooms; Houston with 150 projects/16,473 rooms; Los Angeles with 141 projects/24,129 rooms; and Nashville with 115 projects/15,179 rooms.
Projects already under construction and those scheduled to start construction in the next 12 months, combined, have a total of 3,782 projects/213,798 rooms and are at cyclical highs. Markets with the greatest number of projects already in the ground and those scheduled to start construction in the next 12 months are New York with 145 projects/24,675 rooms, Dallas with 112 projects/13,854 rooms, Houston with 103 projects/11,562 rooms, Los Angeles with 92 projects/14,249 rooms, and Nashville with 88 projects/12,322 rooms.
In the third quarter, Los Angeles has the highest number of new projects announced into the pipeline with 22 projects/6,457 rooms. Detroit follows Los Angeles with 18 projects/1,937 rooms, Dallas with 14 projects/1,529 rooms, New York City with 12 projects/1,857 rooms, and then Atlanta with 12 projects/1,354 rooms.
Reflecting the strong cyclical highs in the pipeline, LE’s forecast for new hotel openings will continue to rise in 2018-2020. In 2018, New York City tops the list with 29 new hotels expected to open/5,351 rooms, Dallas with 29 projects/3,187 rooms, Houston with 27 projects/3,259 rooms, Nashville with 22 projects/3,018 rooms, and Los Angeles with 12 projects/2,152 rooms. In the 2019 forecast, New York continues to lead with the highest number of new hotels expected to open with 59 projects/8,964 rooms followed by Houston with 31 projects/3,098 rooms and Dallas with 30 projects/3,379 rooms. In 2020, Dallas is forecast to take the lead for new hotel openings with 41 projects/4,809 rooms expected to open, followed by New York with 36 projects/5,978 rooms, and Los Angeles with 33 projects/4,292 rooms expected to open.
With the exception of New York City and Houston, the other markets mentioned in the opening show that supply growth has begun to surpass demand. The variances in 2018 year-to-date are small but are certain to widen in the next two years, given the strength of these pipeline in the markets.
All in all, 10 of the top 25 markets show supply growth minimally exceeding demand growth in 2018.
Related Stories
Industrial Facilities | Apr 14, 2022
JLL's take on the race for industrial space
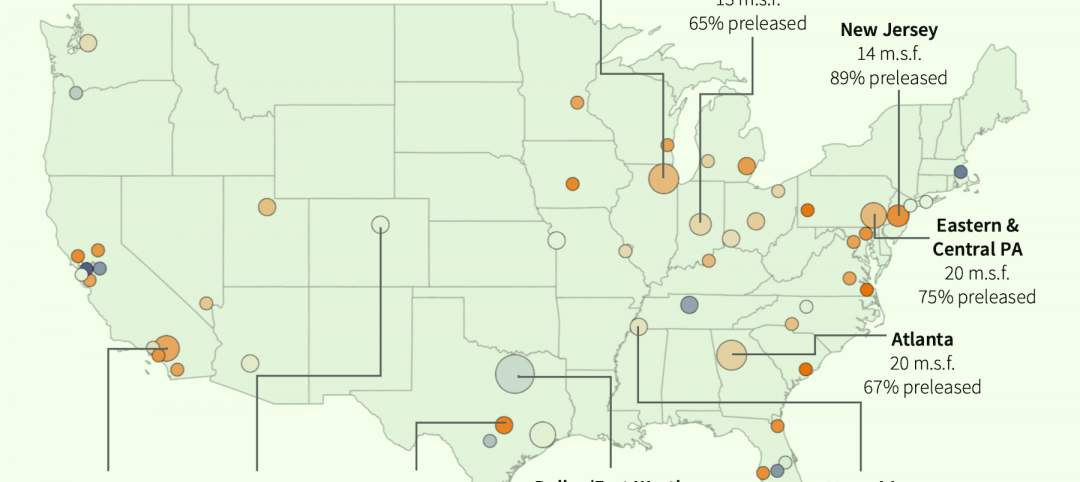
In the previous decade, the inventory of industrial space couldn’t keep up with demand that was driven by the dual surges of the coronavirus and online shopping. Vacancies declined and rents rose. JLL has just published a research report on this sector called “The Race for Industrial Space.” Mehtab Randhawa, JLL’s Americas Head of Industrial Research, shares the highlights of a new report on the industrial sector's growth.

Codes and Standards | Apr 4, 2022
Construction of industrial space continues robust growth
Construction and development of new industrial space in the U.S. remains robust, with all signs pointing to another big year in this market segment

Reconstruction & Renovation | Mar 28, 2022
Is your firm a reconstruction sector giant?
Is your firm active in the U.S. building reconstruction, renovation, historic preservation, and adaptive reuse markets? We invite you to participate in BD+C's inaugural Reconstruction Market Research Report.

Industry Research | Mar 28, 2022
ABC Construction Backlog Indicator unchanged in February
Associated Builders and Contractors reported today that its Construction Backlog Indicator remained unchanged at 8.0 months in February, according to an ABC member survey conducted Feb. 21 to March 8.

Industry Research | Mar 23, 2022
Architecture Billings Index (ABI) shows the demand for design service continues to grow
Demand for design services in February grew slightly since January, according to a new report today from The American Institute of Architects (AIA).

Codes and Standards | Mar 1, 2022
Engineering Business Sentiment study finds optimism despite growing economic concerns
The ACEC Research Institute found widespread optimism among engineering firm executives in its second quarterly Engineering Business Sentiment study.

Codes and Standards | Feb 24, 2022
Most owners adapting digital workflows on projects
Owners are more deeply engaged with digital workflows than other project team members, according to a new report released by Trimble and Dodge Data & Analytics.

Market Data | Feb 23, 2022
2022 Architecture Billings Index indicates growth
The Architectural Billings Index measures the general sentiment of U.S. architecture firms about the health of the construction market by measuring 1) design billings and 2) design contracts. Any score above 50 means that, among the architecture firms surveyed, more firms than not reported seeing increases in design work vs. the previous month.

Market Data | Feb 15, 2022
Materials prices soar 20% between January 2021 and January 2022
Contractors' bid prices accelerate but continue to lag cost increases.

Market Data | Feb 4, 2022
Construction employment dips in January despite record rise in wages, falling unemployment
The quest for workers intensifies among industries.


