


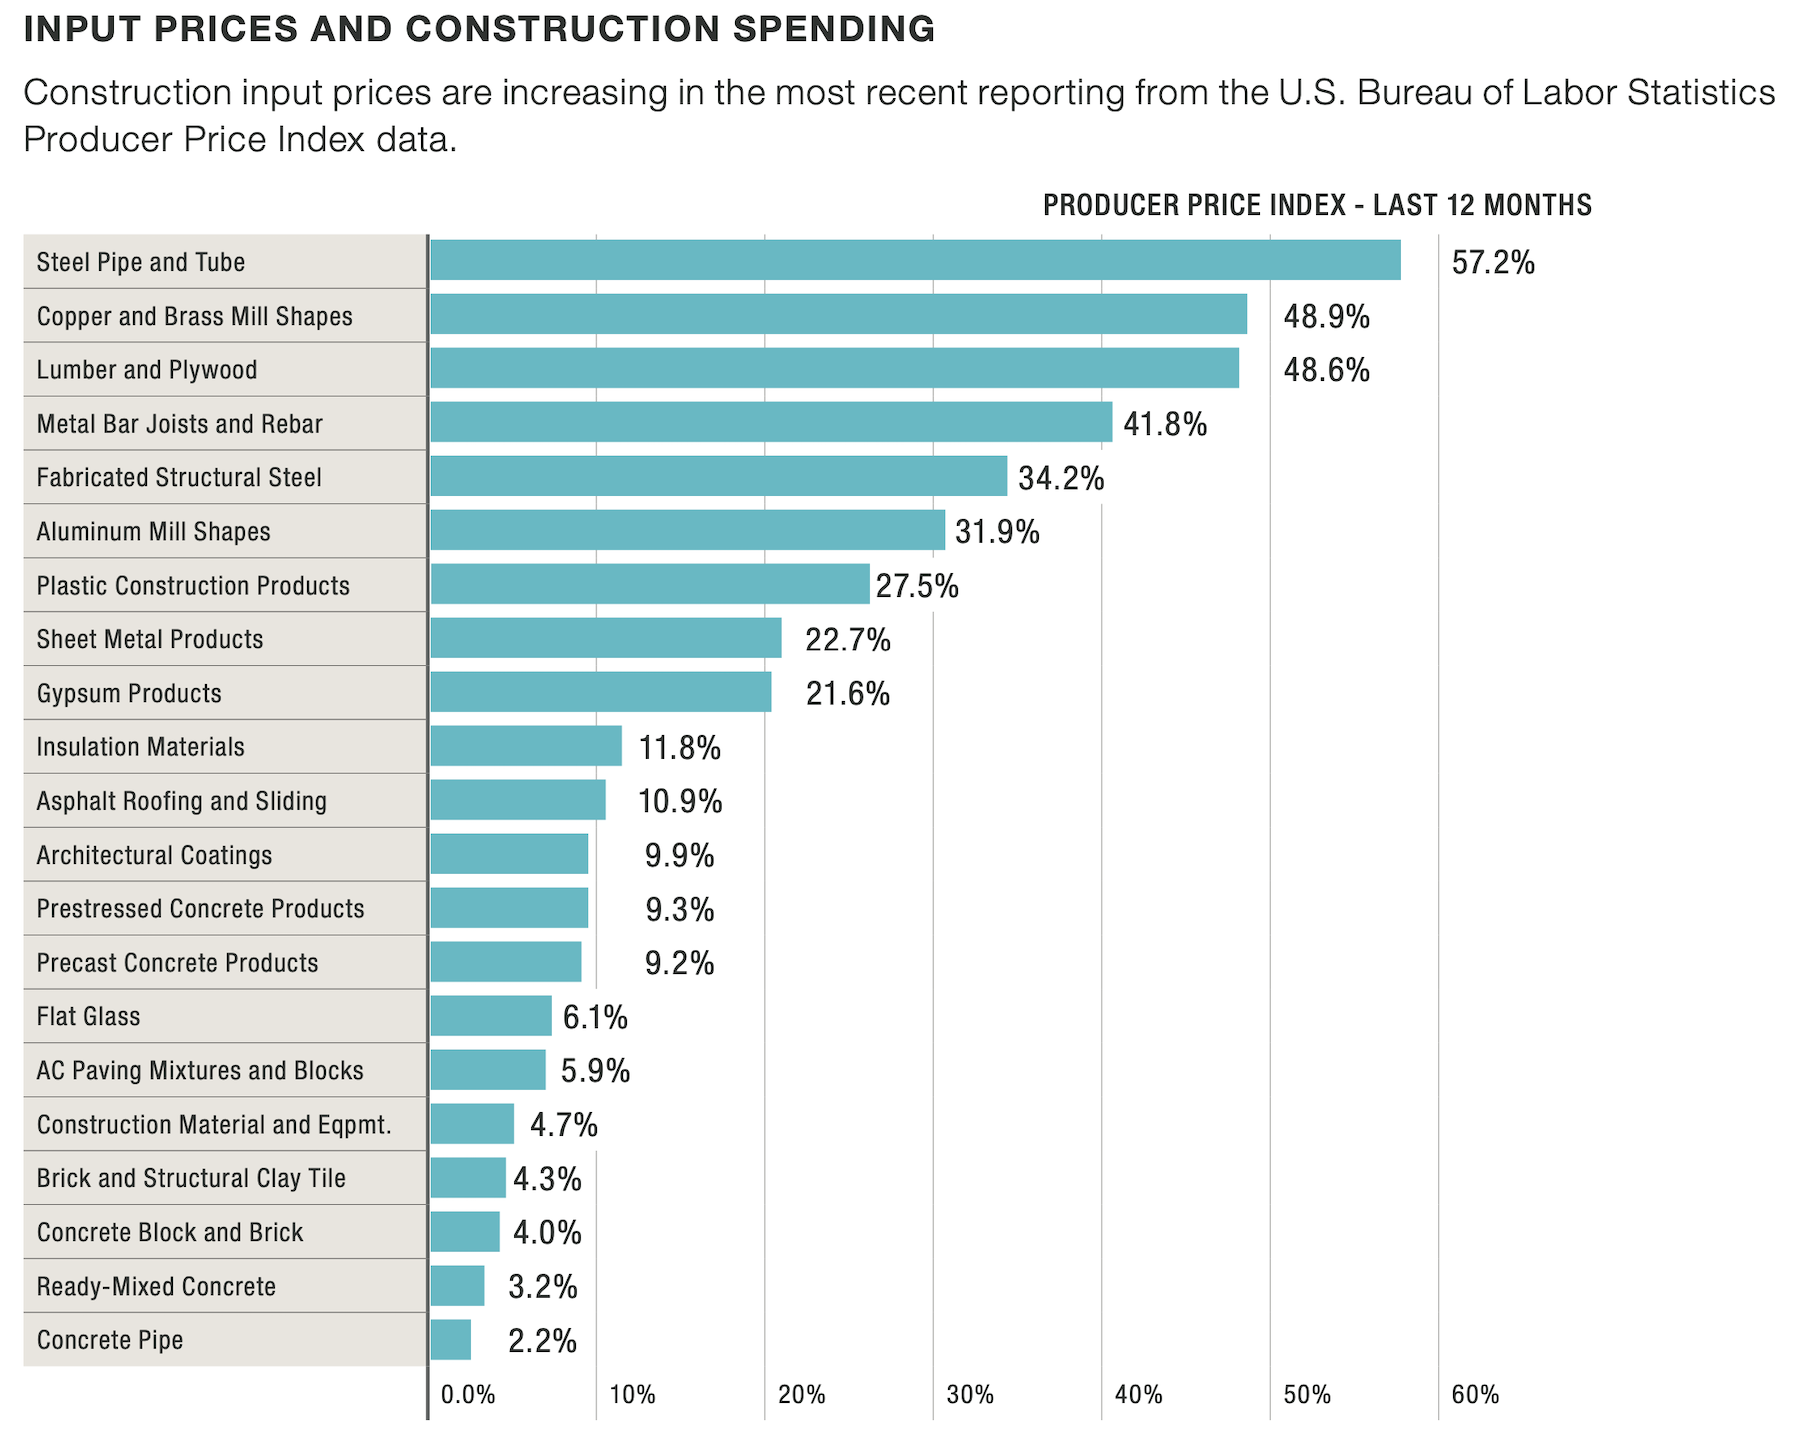
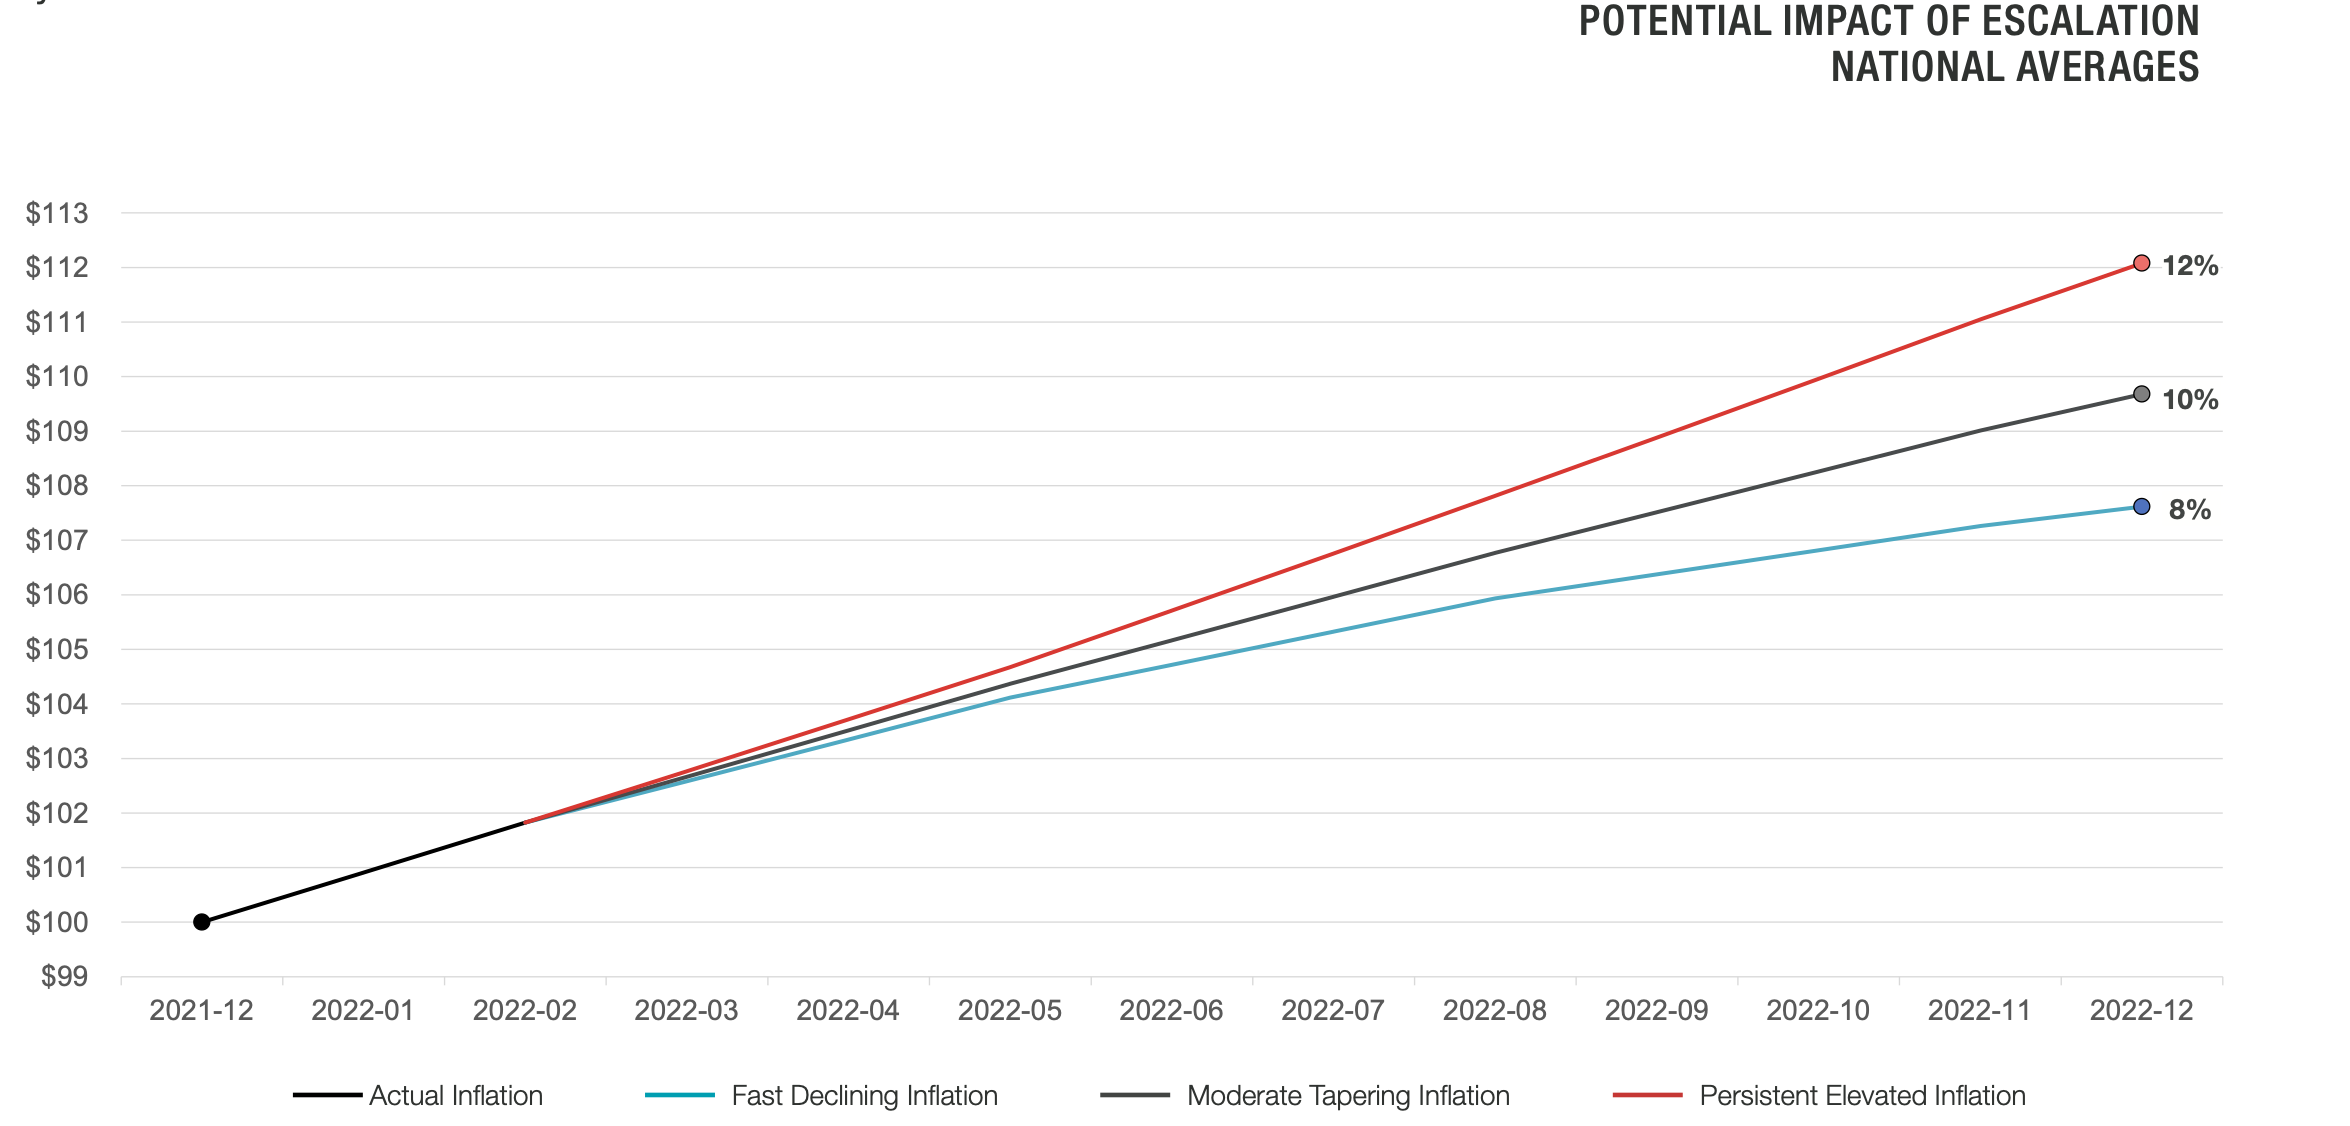
In the first six months of 2022, quarter-to-quarter inflation for construction materials showed signs of easing, but only slightly. “It’s important to clarify that costs are not decreasing; a more accurate description is that [they are] getting expensive less quickly,” stated Dallas-based architecture and construction firm The Beck Group, in its Summer 2022 Biannual Cost Report, which Beck released this week.
Covering January through June of this year, the report combines market data from a variety of sources—including AIA, FMI, McKinsey & Company, Autodesk, Cumming, the Urban Land Institute, and Associated General Contractors of America—with insights from the firm’s preconstruction teams in six markets: Atlanta, Austin, Charlotte, Dallas-Fort Worth, Denver, and the state of Florida.
Market conditions remain challenging nearly everywhere. “Schedule-related constraints are a new norm in today’s market,” The Beck Group contends. “Construction firms are in the middle of suppliers who can’t or won’t commit to pricing longer than 10 days and owners with historically prolonged approval processes. This reality conflicts with the past when it was still possible to hold pricing for upwards of 60 days.”
That being said, The Beck Group claims that the industry is on the cusp of a “new era in collaboration to manage costs and schedules.” That is especially true for developers and owners that bring their AEC partners into projects as early as possible. In its report, The Beck Group offers a list of strategies for managing inflation and supply-chain disruptions that mostly revolve around earlier procurement (see box).
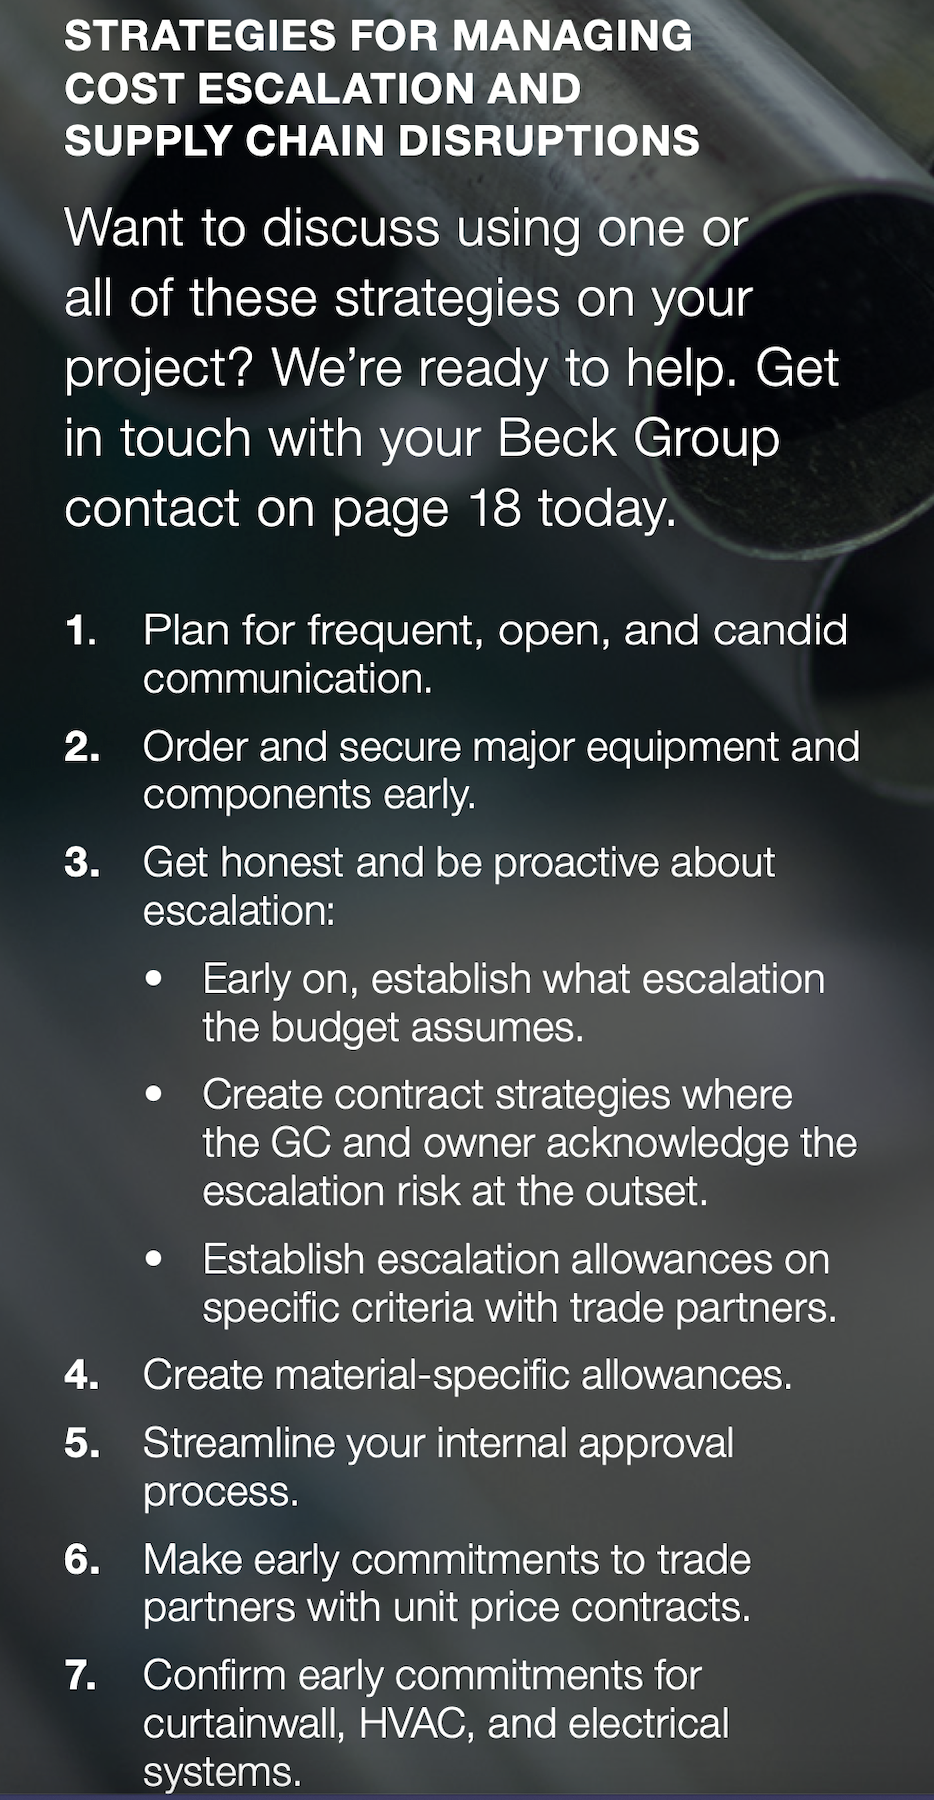
Beck itself creates procurement packages for its clients to secure materials and equipment, a service that involves the firm’s design and construction teams.
DENVER AN EXPENSIVE PLACE TO BUILD IN
On the whole, The Beck Group is seeing significant demand and construction activities in the Sun Belt, in line with the “constant migration” of people and businesses to that region. (It points out, for example, that 43 high-rise towers are under development or construction in Austin.) To keep up with that demand, subcontractors in Texas must rely on imported cement (which, ironically, is among the construction materials least affected by current inflation).
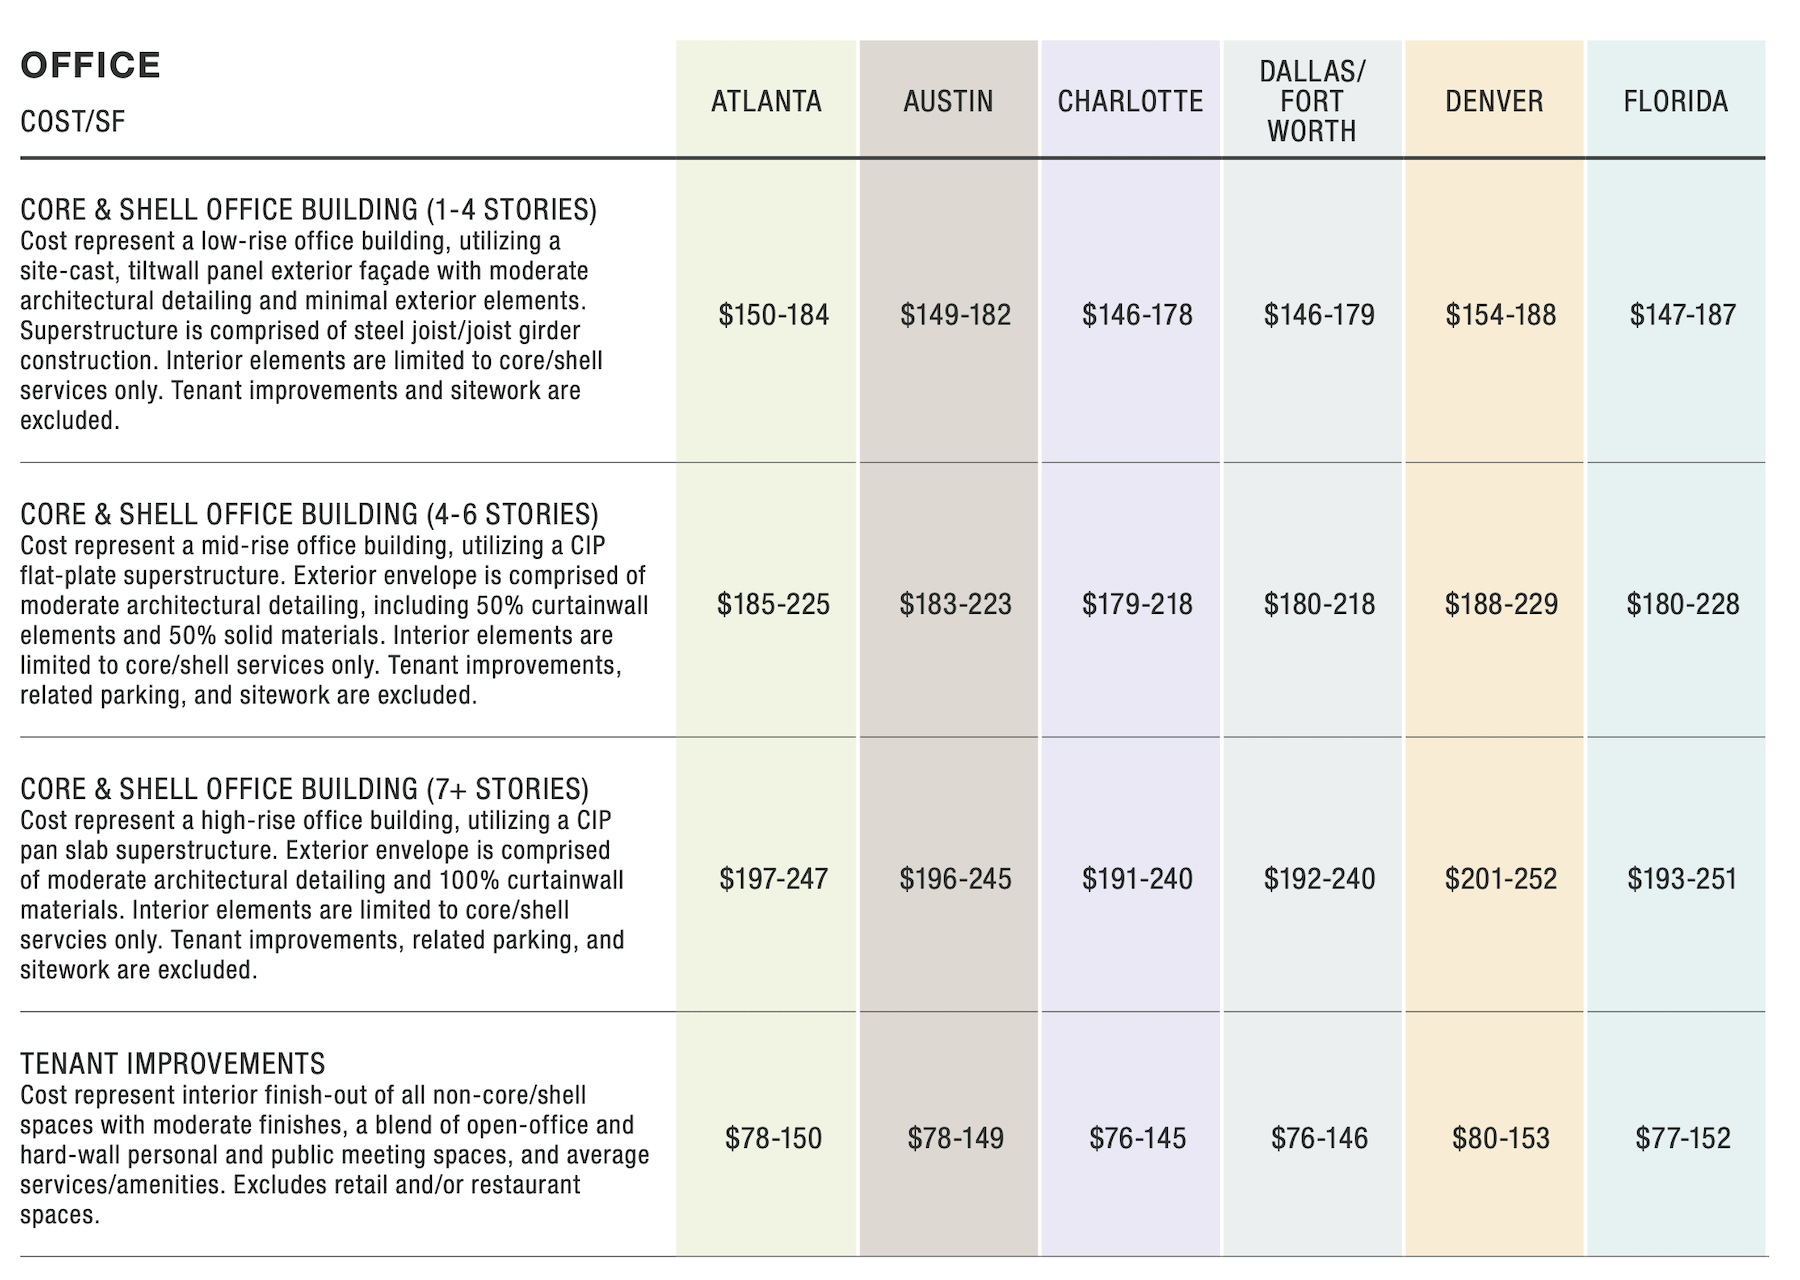
The report takes a deeper dive into the six Sun Belt markets mentioned above, and breaks down project costs by building types—office, healthcare, higher education, faith-based, hospitality, parking, and site work—and their respective sub niches.
The Denver metro is experiencing high demand for multifamily and mixed-use projects. Existing and planned projects are plentiful in the Atlanta market, and subcontractors report substantial backlogs. Building activity in the Florida market remains healthy, bolstered by the state’s economy that is expected to expand by 4 percent between now and 2024. The most significant demand for construction is education, healthcare, and aviation.
Across all building types, it costs more to build or renovate in Denver than in the other five markets, albeit only marginally so in several cases. For example, in healthcare, Denver’s costs per sf for ambulatory surgery centers—ranging from $477 to $583—were around $10 to $25 higher than the other metros. Science and lab buildings cost from $650 to $901 per sf to construct in Denver, versus $631 to $885 in Austin, another S+T hotbed.
The report also compares the cost per key to build or renovate hotels in these six markets, as well as the cost per space for parking and the cost per acre for site development.
CONSTRUCTION EMPLOYMENT STRENGTHENING
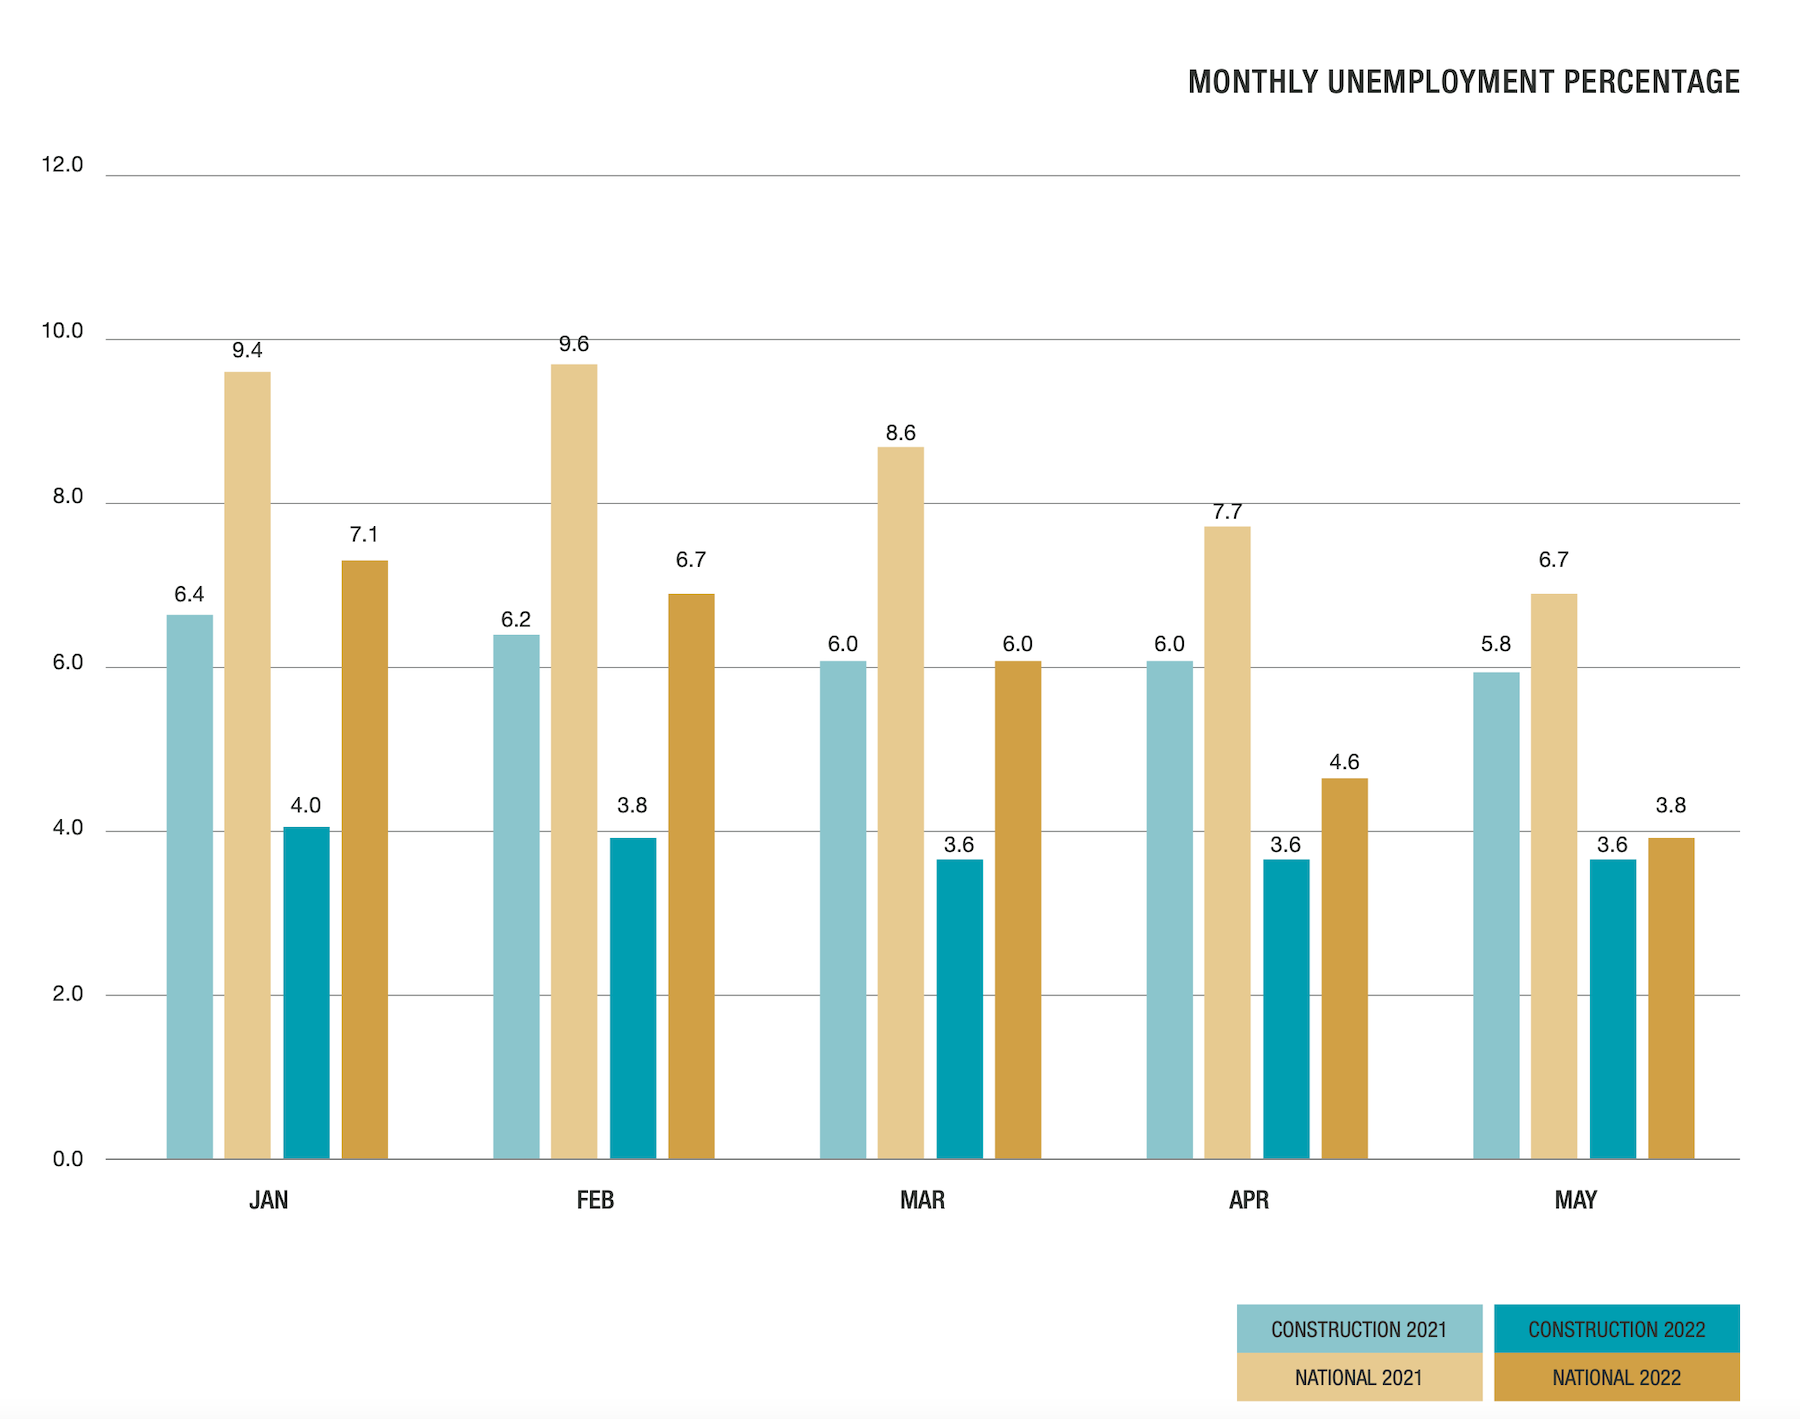
The Beck Group report corroborates what other recent studies have been finding: that the construction employment market, nationally, is improving. Beck predicts this trend to continue as higher wages lure more people into the profession. The employment situation might also explain the slight bump in industry confidence that was evident in the first half of the year.
Related Stories

Market Data | Apr 1, 2019
Nonresidential spending expands again in February
Private nonresidential spending fell 0.5% for the month and is only up 0.1% on a year-over-year basis.

Market Data | Mar 22, 2019
Construction contractors regain confidence in January 2019
Expectations for sales during the coming six-month period remained especially upbeat in January.

Market Data | Mar 21, 2019
Billings moderate in February following robust New Year
AIA’s Architecture Billings Index (ABI) score for February was 50.3, down from 55.3 in January.

Market Data | Mar 19, 2019
ABC’s Construction Backlog Indicator declines sharply in January 2019
The Construction Backlog Indicator contracted to 8.1 months during January 2019.

Market Data | Mar 15, 2019
2019 starts off with expansion in nonresidential spending
At a seasonally adjusted annualized rate, nonresidential spending totaled $762.5 billion for the month.

Market Data | Mar 14, 2019
Construction input prices rise for first time since October
Of the 11 construction subcategories, seven experienced price declines for the month.

Market Data | Mar 6, 2019
Global hotel construction pipeline hits record high at 2018 year-end
There are a record-high 6,352 hotel projects and 1.17 million rooms currently under construction worldwide.

Market Data | Feb 28, 2019
U.S. economic growth softens in final quarter of 2018
Year-over-year GDP growth was 3.1%, while average growth for 2018 was 2.9%.

Market Data | Feb 20, 2019
Strong start to 2019 for architecture billings
“The government shutdown affected architecture firms, but doesn’t appear to have created a slowdown in the profession,” said AIA Chief Economist Kermit Baker, Hon. AIA, PhD, in the latest ABI report.

Market Data | Feb 19, 2019
ABC Construction Backlog Indicator steady in Q4 2018
CBI reached a record high of 9.9 months in the second quarter of 2018 and averaged about 9.1 months throughout all four quarters of last year.


