


After a long period of anemic performance, with growth mostly driven by renovations and additions, the K-12 sector is showing renewed interest in new construction. Consultant Paul Abramson, using data from Dun & Bradstreet, calculates that districts spent about $13.4 billion on construction projects in 2013, about $7.6 billion of which went for new schools (http://bit.ly/1kN4qkv).
Highest-spending regions included Texas-Louisiana-Oklahoma-Arkansas ($2.3 billion, or 17% of the nation’s K-12 total) and Arizona-California-Hawaii-Nevada ($1.68 billion). The lowest-spending regions included debt-plagued Illinois with neighboring states Minnesota and Wisconsin ($651 million) and Alaska-Idaho-Oregon-Washington ($558 million).
High schools are outpacing other K-12 facilities in construction spending, with the dollar value of projected 2014 starts at $4.15 billion, or 44% of the K-12 total. That’s followed by 33% for elementary schools, 23% for middle schools, and <1% for administrative and support projects.
Among the evident design trends: STEM morphing into STEAM with the addition of arts enrichment (sometimes with professional-quality performance spaces) to science, technology, engineering, and math schools; growing enthusiasm for vocational training facilities that provide an alternative to the traditional college prep path; and schools that do a better job of cementing community connections by leveraging local architectural themes.
The push for sustainable K-12 facilities also marches on; at high levels of green, the theme typically suffuses the pedagogy. Hood River (Ore.) Middle School’s Music and Science Building was recently certified net-zero energy by the International Living Future Institute, making it the first public school building to earn the tough-to-achieve designation.
Top K-12 School Sector Architecture Firms
| Rank | Company | 2013 K-12 Revenue |
| 1 | DLR Group | $41,000,000 |
| 2 | SHW Group | 40,016,000 |
| 3 | PBK | 35,880,000 |
| 4 | HMC Architects | 26,097,082 |
| 5 | Fanning/Howey Associates | 17,877,000 |
| 6 | Perkins+will | 16,668,514 |
| 7 | Heery International | 14,994,535 |
| 8 | NAC|Architecture | 14,494,206 |
| 9 | LPA | 14,191,442 |
| 10 | Perkins Eastman | 13,950,000 |
| 11 | Quattrocchi Kwok Architects | 13,230,000 |
| 12 | Moseley Architects | 12,521,613 |
| 13 | Integrus Architecture | 12,229,858 |
| 14 | Corgan | 10,372,178 |
| 15 | FGM Architects | 9,846,977 |
| 16 | NTD Architecture | 9,200,000 |
| 17 | Parkhill, Smith & Cooper | 8,580,000 |
| 18 | Symmes Maini & McKee Associates | 8,375,000 |
| 19 | Stantec | 8,097,800 |
| 20 | SchenkelShultz Architecture | 7,880,000 |
| 21 | SEI Design Group | 7,566,000 |
| 22 | Slaterpaull Architects | 7,500,468 |
| 23 | DLA Architects | 7,255,830 |
| 24 | GWWO | 7,047,216 |
| 25 | BRPH | 6,681,000 |
| 26 | Legat Architects | 6,630,200 |
| 27 | Wight & Company | 6,579,000 |
| 28 | Ashley McGraw Architects | 6,093,874 |
| 29 | HMFH Architects | 6,032,607 |
| 30 | BBS Architects | 5,950,250 |
| 31 | BLDD Architects | 5,750,000 |
| 32 | LaBella Associates | 5,644,772 |
| 33 | LS3P | 5,155,547 |
| 34 | Eppstein Uhen Architects | 4,623,477 |
| 35 | H+L Architecture | 4,070,997 |
| 36 | EwingCole | 4,020,000 |
| 37 | FXFOWLE Architects | 3,940,000 |
| 38 | Harley Ellis Devereaux | 3,780,000 |
| 39 | Cooper Carry | 3,402,330 |
| 40 | Goodwyn Mills & Cawood | 3,399,167 |
| 41 | CTA Architects Engineers | 3,336,600 |
| 42 | HKS | 3,142,143 |
| 43 | Cuningham Group Architecture | 3,052,272 |
| 44 | Schrader Group Architecture | 3,047,414 |
| 45 | NORR | 2,976,836 |
| 46 | Hord Coplan Macht | 2,948,595 |
| 47 | Ratio Architects | 2,879,009 |
| 48 | Albert Kahn Associates | 2,775,253 |
| 49 | IBI Group ? Gruzen Samton | 2,500,000 |
| 50 | RS&H | 2,450,000 |
| 51 | Harvard Jolly Architecture | 2,097,387 |
| 52 | Shepley Bulfinch | 2,000,000 |
| 53 | Becker Morgan Group | 1,945,649 |
| 54 | Leo A Daly | 1,787,681 |
| 55 | Good Fulton & Farrell | 1,704,900 |
| 56 | KZF Design | 1,490,333 |
| 57 | Clark Nexsen | 1,441,748 |
| 58 | Little | 1,410,229 |
| 59 | LMN Architects | 1,223,400 |
| 60 | Smallwood, Reynolds, Stewart, Stewart & Associates | 1,213,567 |
| 61 | Environetics | 1,137,965 |
| 62 | Massa Montalto Architects | 1,056,000 |
| 63 | VOA Associates | 989,711 |
| 64 | Mithun | 930,000 |
| 65 | Gensler | 700,000 |
| 66 | WHR Architects | 699,316 |
| 67 | PGAL | 672,000 |
| 68 | Ennead Architects | 585,055 |
| 69 | Davis Brody Bond | 570,932 |
| 70 | DesignGroup | 538,710 |
| 71 | OZ Architecture | 487,900 |
| 72 | Kirksey | 466,989 |
| 73 | HNTB Corp. | 444,786 |
| 74 | Beyer Blinder Belle | 405,394 |
| 75 | CO Architects | 386,900 |
| 76 | RSP Architects | 377,000 |
| 77 | LawKingdon Architecture | 350,000 |
| 78 | Ziegler Cooper | 348,762 |
| 79 | Morris Architects | 335,000 |
| 80 | Rule Joy Trammell + Rubio | 320,000 |
| 81 | Cambridge Seven Associates | 305,000 |
| 82 | Ware Malcomb | 284,000 |
| 83 | Hoffmann Architects | 260,000 |
| 84 | CASCO Diversified Corp. | 250,000 |
| 85 | JRS Architect | 235,000 |
| 86 | Rosser International | 230,000 |
| 87 | Page | 229,000 |
| 88 | Nelson | 210,577 |
| 89 | Gresham, Smith and Partners | 200,000 |
| 90 | Hastings+Chivetta Architects | 169,568 |
| 91 | Nadel | 130,000 |
| 92 | Epstein | 108,000 |
| 93 | BSA LifeStructures | 106,426 |
| 94 | ATA Beilharz Architects | 104,525 |
| 95 | Niles Bolton Associates | 104,386 |
| 96 | Hensley Lamkin Rachel | 100,000 |
| 97 | GBBN Architects | 97,000 |
| 98 | Sherlock, Smith & Adams | 92,000 |
| 99 | Lord Aeck Sargent | 75,379 |
| 100 | Poskanzer Skott | 50,000 |
| 101 | TEG Architects | 11,928 |
Top K-12 School Sector Engineering Firms
| Rank | Company | 2013 K-12 Revenue |
| 1 | AECOM Technology Corp. | $50,930,000 |
| 2 | URS Corp. | 47,642,239 |
| 3 | Jacobs | 35,150,000 |
| 4 | Parsons Brinckerhoff | 20,057,993 |
| 5 | TTG | 12,352,642 |
| 6 | STV | 8,018,000 |
| 7 | Shive-Hattery | 5,975,671 |
| 8 | KCI Technologies | 4,800,000 |
| 9 | Dewberry | 4,340,398 |
| 10 | Joseph R. Loring & Associates | 4,300,000 |
| 11 | Heapy Engineering | 4,079,921 |
| 12 | Thornton Tomasetti | 3,617,144 |
| 13 | Wiss, Janney, Elstner Associates | 3,380,000 |
| 14 | Allen & Shariff | 3,000,000 |
| 15 | Interface Engineering | 2,934,922 |
| 16 | KJWW Engineering Consultants | 2,878,919 |
| 17 | Paulus, Sokolowski and Sartor | 2,800,000 |
| 18 | Brinjac Engineering | 2,677,720 |
| 19 | Simpson Gumpertz & Heger | 2,610,000 |
| 20 | M/E Engineering | 2,531,610 |
| 21 | Primera Engineers | 2,357,000 |
| 22 | French & Parrello Associates | 2,297,300 |
| 23 | Coffman Engineers | 2,147,260 |
| 24 | Henderson Engineers | 2,103,903 |
| 25 | Bridgers & Paxton Consulting Engineers | 2,024,344 |
| 26 | RDK Engineers | 1,880,000 |
| 27 | Wallace Engineering | 1,691,000 |
| 28 | KPFF Consulting Engineers | 1,625,000 |
| 29 | H.F. Lenz | 1,619,250 |
| 30 | Highland Associates | 1,600,000 |
| 31 | KLH Engineers | 1,384,045 |
| 32 | Glumac | 1,306,149 |
| 33 | AKF Group | 1,299,000 |
| 34 | Rist-Frost-Shumway Engineering | 1,000,000 |
| 35 | Fishbeck, Thompson, Carr & Huber | 1,000,000 |
| 36 | CJL Engineering | 994,410 |
| 37 | TLC Engineering for Architecture | 967,161 |
| 38 | M-E Engineers | 966,000 |
| 39 | Walter P Moore and Associates | 937,062 |
| 40 | Vanderweil Engineers | 808,300 |
| 41 | Karpinski Engineering | 720,037 |
| 42 | Sparling | 682,833 |
| 43 | Martin/Martin | 674,166 |
| 44 | SSOE Group | 664,516 |
| 45 | RMF Engineering | 650,000 |
| 46 | Aon Fire Protection Engineering Corp. | 540,000 |
| 47 | Newcomb & Boyd | 534,136 |
| 48 | Environmental Systems Design | 521,731 |
| 49 | Guernsey | 502,819 |
| 50 | I. C. Thomasson Associates | 500,000 |
| 51 | G&W Engineering Corp. | 484,000 |
| 52 | Wick Fisher White | 446,553 |
| 53 | Arup | 431,084 |
| 54 | CTLGroup | 400,000 |
| 55 | OLA Consulting Engineers | 308,400 |
| 56 | Kamm Consulting | 286,426 |
| 57 | DeSimone Consulting Engineers | 262,015 |
| 58 | GRW | 189,200 |
| 59 | Zak Companies | 178,364 |
| 60 | Dunham Associates | 150,000 |
| 61 | Mazzetti | 149,031 |
| 62 | Davis, Bowen & Friedel | 132,028 |
| 63 | Affiliated Engineers | 112,000 |
| 64 | Spectrum Engineers | 93,110 |
| 65 | Magnusson Klemencic Associates | 76,069 |
Top K-12 School Sector Construction Firms
| Rank | Company | 2013 K-12 Revenue |
| 1 | Gilbane | $480,230,252 |
| 2 | Turner Construction | 419,619,000 |
| 3 | Balfour Beatty US | 372,288,885 |
| 4 | CORE Construction Group | 278,177,865 |
| 5 | Skanska USA | 212,802,648 |
| 6 | Swinerton Builders | 182,000,000 |
| 7 | Kraus-Anderson Construction | 181,000,000 |
| 8 | JE Dunn Construction | 167,798,654 |
| 9 | Consigli Construction | 151,997,147 |
| 10 | Whiting-Turner Contracting Co., The | 146,933,150 |
| 11 | Adolfson & Peterson Construction | 142,957,713 |
| 12 | Barton Malow | 142,524,833 |
| 13 | McCarthy Holdings | 140,400,000 |
| 14 | PCL Construction | 122,996,983 |
| 15 | Tutor Perini Corp. | 120,049,254 |
| 16 | McShane Companies, The | 118,124,887 |
| 17 | Flintco | 110,350,000 |
| 18 | KBE Building Corp. | 89,239,714 |
| 19 | Bernards | 85,000,000 |
| 20 | Sundt Construction | 69,522,647 |
| 21 | Absher Construction | 67,476,142 |
| 22 | LeChase Construction Services | 65,600,000 |
| 23 | Walsh Group, The | 62,965,887 |
| 24 | Wight & Company | 61,092,000 |
| 25 | Lend Lease | 59,255,000 |
| 26 | Haselden Construction | 55,166,396 |
| 27 | LPCiminelli | 54,810,831 |
| 28 | Shawmut Design and Construction | 51,000,000 |
| 29 | Ryan Companies US | 48,316,285 |
| 30 | URS Corp. | 47,642,239 |
| 31 | Yates Companies, The | 42,800,000 |
| 32 | Pepper Construction | 35,760,000 |
| 33 | C.W. Driver | 35,595,000 |
| 34 | E.W. Howell | 33,818,000 |
| 35 | Coakley & Williams Construction | 32,267,167 |
| 36 | Brasfield & Gorrie | 30,364,402 |
| 37 | Choate Construction | 30,237,395 |
| 38 | Bette Companies, The | 29,375,000 |
| 39 | S. M. Wilson & Co. | 25,725,568 |
| 40 | Suffolk Construction | 25,620,266 |
| 41 | EMJ Corp. | 24,000,000 |
| 42 | Parsons Brinckerhoff | 20,057,993 |
| 43 | Manhattan Construction | 19,124,000 |
| 44 | New South Construction | 17,650,000 |
| 45 | Hill & Wilkinson | 17,026,000 |
| 46 | Kitchell Corp. | 16,545,918 |
| 47 | Heery International | 14,994,535 |
| 48 | HITT Contracting | 14,900,000 |
| 49 | Robins & Morton | 13,176,447 |
| 50 | W. M. Jordan Company | 12,735,471 |
| 51 | Messer Construction | 12,453,591 |
| 52 | Structure Tone | 12,081,000 |
| 53 | Hill International | 12,000,000 |
| 54 | Boldt Company, The | 11,978,048 |
| 55 | Hathaway Dinwiddie Construction | 11,690,000 |
| 56 | James G. Davis Construction | 10,187,161 |
| 57 | Stalco Construction | 10,040,000 |
| 58 | STV | 8,018,000 |
| 59 | Hunt Construction Group | 7,000,000 |
| 60 | O'Neil Industries/W.E. O'Neil | 5,825,412 |
| 61 | Weis Builders | 3,389,000 |
| 62 | Beck Group, The | 3,117,539 |
| 63 | Allen & Shariff | 3,000,000 |
| 64 | Linbeck Group | 2,590,000 |
| 65 | Batson-Cook | 1,810,861 |
| 66 | Hoar Construction | 1,769,000 |
| 67 | Clark Group | 1,731,296 |
| 68 | James McHugh Construction | 1,460,905 |
| 69 | Weitz Company, The | 1,434,533 |
| 70 | IMC Construction | 1,433,690 |
| 71 | Astorino | 743,040 |
| 72 | JLL | 242,655 |
Read BD+C's full 2014 Giants 300 Report
Related Stories

| Apr 14, 2011
How AEC Professionals Choose Windows and Doors
Window and door systems need to perform. Respondents to our annual window and door survey overwhelmingly reported that performance, weather resistance, durability, and quality were key reasons a particular window or door was specified.
| Apr 14, 2011
USGBC debuts LEED for Healthcare
The U.S. Green Building Council (USGBC) introduces its latest green building rating system, LEED for Healthcare. The rating system guides the design and construction of both new buildings and major renovations of existing buildings, and can be applied to inpatient, outpatient and licensed long-term care facilities, medical offices, assisted living facilities and medical education and research centers.
| Apr 13, 2011
National Roofing Contractors Association revises R-value of polyisocyanurate (ISO) insulation
NRCA has updated their R-value recommendation for polyisocyanurate roof insulation with the publication of the 2011 The NRCA Roofing Manual: Membrane Roof Systems.

| Apr 13, 2011
Professor Edward Glaeser, PhD, on how cities are mankind’s greatest invention
Edward Glaeser, PhD, the Fred and Eleanor Glimp Professor of Economics at Harvard University and director of the Taubman Center for State and Local Government and the Rappaport Institute for Greater Boston, as well as the author of Triumph of the City: How Our Greatest Invention Makes Us Richer, Smarter, Healthier, and Happier, on how cities are mankind’s greatest invention.
| Apr 13, 2011
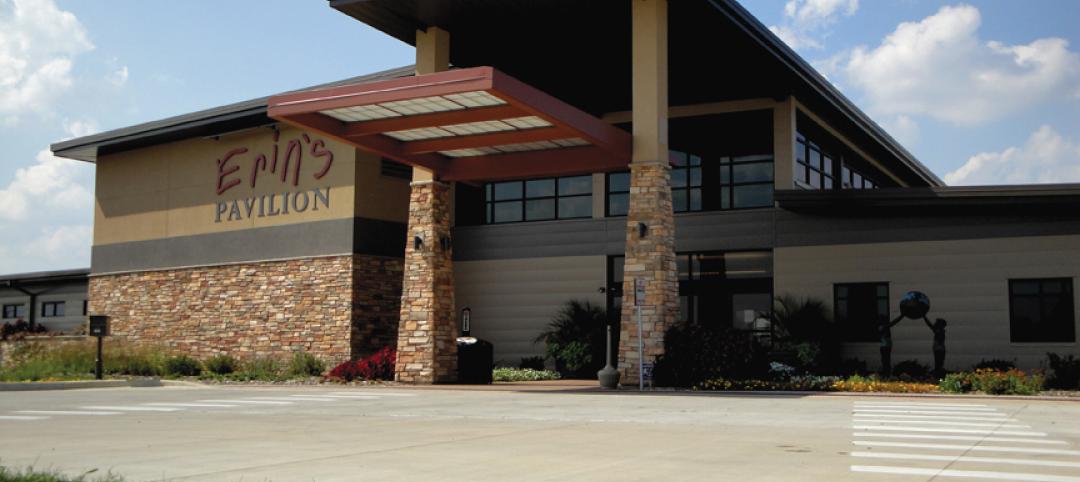
Southern Illinois park pavilion earns LEED Platinum
Erin’s Pavilion, a welcome and visitors center at the 80-acre Edwin Watts Southwind Park in Springfield, Ill., earned LEED Platinum. The new 16,000-sf facility, a joint project between local firm Walton and Associates Architects and the sustainability consulting firm Vertegy, based in St. Louis, serves as a community center and special needs education center, and is named for Erin Elzea, who struggled with disabilities during her life.

| Apr 13, 2011
Virginia hospital’s prescription for green construction: LEED Gold
Rockingham Memorial Hospital in Harrisonburg, Va., is the commonwealth’s first inpatient healthcare facility to earn LEED Gold. The 630,000-sf facility was designed by Earl Swensson Associates, with commissioning consultant SSRCx, both of Nashville.

| Apr 13, 2011
Office interaction was the critical element to Boston buildout
Margulies Perruzzi Architects, Boston, designed the new 11,460-sf offices for consultant Interaction Associates and its nonprofit sister organization, The Interaction Institute for Social Change, inside an old warehouse near Boston’s Seaport Center.

| Apr 13, 2011
Expanded Museum of the Moving Image provides a treat for the eyes
The expansion and renovation of the Museum of the Moving Image in the Astoria section of Queens, N.Y., involved a complete redesign of its first floor and the construction of a three-story 47,000-sf addition.

| Apr 13, 2011
Duke University parking garage driven to LEED certification
People parking their cars inside the new Research Drive garage at Duke University are making history—they’re utilizing the country’s first freestanding LEED-certified parking structure.

| Apr 13, 2011
Red Bull Canada HQ a mix of fluid spaces and high-energy design
The Toronto architecture firm Johnson Chou likes to put a twist on its pared-down interiors, and its work on the headquarters for Red Bull Canada is no exception. The energy drink maker occupies 12,300 sf on the top two floors of a three-story industrial building in Toronto, and the design strategy for its space called for leaving the base building virtually untouched while attention was turned to the interior architecture.


