


After a long period of anemic performance, with growth mostly driven by renovations and additions, the K-12 sector is showing renewed interest in new construction. Consultant Paul Abramson, using data from Dun & Bradstreet, calculates that districts spent about $13.4 billion on construction projects in 2013, about $7.6 billion of which went for new schools (http://bit.ly/1kN4qkv).
Highest-spending regions included Texas-Louisiana-Oklahoma-Arkansas ($2.3 billion, or 17% of the nation’s K-12 total) and Arizona-California-Hawaii-Nevada ($1.68 billion). The lowest-spending regions included debt-plagued Illinois with neighboring states Minnesota and Wisconsin ($651 million) and Alaska-Idaho-Oregon-Washington ($558 million).
High schools are outpacing other K-12 facilities in construction spending, with the dollar value of projected 2014 starts at $4.15 billion, or 44% of the K-12 total. That’s followed by 33% for elementary schools, 23% for middle schools, and <1% for administrative and support projects.
Among the evident design trends: STEM morphing into STEAM with the addition of arts enrichment (sometimes with professional-quality performance spaces) to science, technology, engineering, and math schools; growing enthusiasm for vocational training facilities that provide an alternative to the traditional college prep path; and schools that do a better job of cementing community connections by leveraging local architectural themes.
The push for sustainable K-12 facilities also marches on; at high levels of green, the theme typically suffuses the pedagogy. Hood River (Ore.) Middle School’s Music and Science Building was recently certified net-zero energy by the International Living Future Institute, making it the first public school building to earn the tough-to-achieve designation.
Top K-12 School Sector Architecture Firms
| Rank | Company | 2013 K-12 Revenue |
| 1 | DLR Group | $41,000,000 |
| 2 | SHW Group | 40,016,000 |
| 3 | PBK | 35,880,000 |
| 4 | HMC Architects | 26,097,082 |
| 5 | Fanning/Howey Associates | 17,877,000 |
| 6 | Perkins+will | 16,668,514 |
| 7 | Heery International | 14,994,535 |
| 8 | NAC|Architecture | 14,494,206 |
| 9 | LPA | 14,191,442 |
| 10 | Perkins Eastman | 13,950,000 |
| 11 | Quattrocchi Kwok Architects | 13,230,000 |
| 12 | Moseley Architects | 12,521,613 |
| 13 | Integrus Architecture | 12,229,858 |
| 14 | Corgan | 10,372,178 |
| 15 | FGM Architects | 9,846,977 |
| 16 | NTD Architecture | 9,200,000 |
| 17 | Parkhill, Smith & Cooper | 8,580,000 |
| 18 | Symmes Maini & McKee Associates | 8,375,000 |
| 19 | Stantec | 8,097,800 |
| 20 | SchenkelShultz Architecture | 7,880,000 |
| 21 | SEI Design Group | 7,566,000 |
| 22 | Slaterpaull Architects | 7,500,468 |
| 23 | DLA Architects | 7,255,830 |
| 24 | GWWO | 7,047,216 |
| 25 | BRPH | 6,681,000 |
| 26 | Legat Architects | 6,630,200 |
| 27 | Wight & Company | 6,579,000 |
| 28 | Ashley McGraw Architects | 6,093,874 |
| 29 | HMFH Architects | 6,032,607 |
| 30 | BBS Architects | 5,950,250 |
| 31 | BLDD Architects | 5,750,000 |
| 32 | LaBella Associates | 5,644,772 |
| 33 | LS3P | 5,155,547 |
| 34 | Eppstein Uhen Architects | 4,623,477 |
| 35 | H+L Architecture | 4,070,997 |
| 36 | EwingCole | 4,020,000 |
| 37 | FXFOWLE Architects | 3,940,000 |
| 38 | Harley Ellis Devereaux | 3,780,000 |
| 39 | Cooper Carry | 3,402,330 |
| 40 | Goodwyn Mills & Cawood | 3,399,167 |
| 41 | CTA Architects Engineers | 3,336,600 |
| 42 | HKS | 3,142,143 |
| 43 | Cuningham Group Architecture | 3,052,272 |
| 44 | Schrader Group Architecture | 3,047,414 |
| 45 | NORR | 2,976,836 |
| 46 | Hord Coplan Macht | 2,948,595 |
| 47 | Ratio Architects | 2,879,009 |
| 48 | Albert Kahn Associates | 2,775,253 |
| 49 | IBI Group ? Gruzen Samton | 2,500,000 |
| 50 | RS&H | 2,450,000 |
| 51 | Harvard Jolly Architecture | 2,097,387 |
| 52 | Shepley Bulfinch | 2,000,000 |
| 53 | Becker Morgan Group | 1,945,649 |
| 54 | Leo A Daly | 1,787,681 |
| 55 | Good Fulton & Farrell | 1,704,900 |
| 56 | KZF Design | 1,490,333 |
| 57 | Clark Nexsen | 1,441,748 |
| 58 | Little | 1,410,229 |
| 59 | LMN Architects | 1,223,400 |
| 60 | Smallwood, Reynolds, Stewart, Stewart & Associates | 1,213,567 |
| 61 | Environetics | 1,137,965 |
| 62 | Massa Montalto Architects | 1,056,000 |
| 63 | VOA Associates | 989,711 |
| 64 | Mithun | 930,000 |
| 65 | Gensler | 700,000 |
| 66 | WHR Architects | 699,316 |
| 67 | PGAL | 672,000 |
| 68 | Ennead Architects | 585,055 |
| 69 | Davis Brody Bond | 570,932 |
| 70 | DesignGroup | 538,710 |
| 71 | OZ Architecture | 487,900 |
| 72 | Kirksey | 466,989 |
| 73 | HNTB Corp. | 444,786 |
| 74 | Beyer Blinder Belle | 405,394 |
| 75 | CO Architects | 386,900 |
| 76 | RSP Architects | 377,000 |
| 77 | LawKingdon Architecture | 350,000 |
| 78 | Ziegler Cooper | 348,762 |
| 79 | Morris Architects | 335,000 |
| 80 | Rule Joy Trammell + Rubio | 320,000 |
| 81 | Cambridge Seven Associates | 305,000 |
| 82 | Ware Malcomb | 284,000 |
| 83 | Hoffmann Architects | 260,000 |
| 84 | CASCO Diversified Corp. | 250,000 |
| 85 | JRS Architect | 235,000 |
| 86 | Rosser International | 230,000 |
| 87 | Page | 229,000 |
| 88 | Nelson | 210,577 |
| 89 | Gresham, Smith and Partners | 200,000 |
| 90 | Hastings+Chivetta Architects | 169,568 |
| 91 | Nadel | 130,000 |
| 92 | Epstein | 108,000 |
| 93 | BSA LifeStructures | 106,426 |
| 94 | ATA Beilharz Architects | 104,525 |
| 95 | Niles Bolton Associates | 104,386 |
| 96 | Hensley Lamkin Rachel | 100,000 |
| 97 | GBBN Architects | 97,000 |
| 98 | Sherlock, Smith & Adams | 92,000 |
| 99 | Lord Aeck Sargent | 75,379 |
| 100 | Poskanzer Skott | 50,000 |
| 101 | TEG Architects | 11,928 |
Top K-12 School Sector Engineering Firms
| Rank | Company | 2013 K-12 Revenue |
| 1 | AECOM Technology Corp. | $50,930,000 |
| 2 | URS Corp. | 47,642,239 |
| 3 | Jacobs | 35,150,000 |
| 4 | Parsons Brinckerhoff | 20,057,993 |
| 5 | TTG | 12,352,642 |
| 6 | STV | 8,018,000 |
| 7 | Shive-Hattery | 5,975,671 |
| 8 | KCI Technologies | 4,800,000 |
| 9 | Dewberry | 4,340,398 |
| 10 | Joseph R. Loring & Associates | 4,300,000 |
| 11 | Heapy Engineering | 4,079,921 |
| 12 | Thornton Tomasetti | 3,617,144 |
| 13 | Wiss, Janney, Elstner Associates | 3,380,000 |
| 14 | Allen & Shariff | 3,000,000 |
| 15 | Interface Engineering | 2,934,922 |
| 16 | KJWW Engineering Consultants | 2,878,919 |
| 17 | Paulus, Sokolowski and Sartor | 2,800,000 |
| 18 | Brinjac Engineering | 2,677,720 |
| 19 | Simpson Gumpertz & Heger | 2,610,000 |
| 20 | M/E Engineering | 2,531,610 |
| 21 | Primera Engineers | 2,357,000 |
| 22 | French & Parrello Associates | 2,297,300 |
| 23 | Coffman Engineers | 2,147,260 |
| 24 | Henderson Engineers | 2,103,903 |
| 25 | Bridgers & Paxton Consulting Engineers | 2,024,344 |
| 26 | RDK Engineers | 1,880,000 |
| 27 | Wallace Engineering | 1,691,000 |
| 28 | KPFF Consulting Engineers | 1,625,000 |
| 29 | H.F. Lenz | 1,619,250 |
| 30 | Highland Associates | 1,600,000 |
| 31 | KLH Engineers | 1,384,045 |
| 32 | Glumac | 1,306,149 |
| 33 | AKF Group | 1,299,000 |
| 34 | Rist-Frost-Shumway Engineering | 1,000,000 |
| 35 | Fishbeck, Thompson, Carr & Huber | 1,000,000 |
| 36 | CJL Engineering | 994,410 |
| 37 | TLC Engineering for Architecture | 967,161 |
| 38 | M-E Engineers | 966,000 |
| 39 | Walter P Moore and Associates | 937,062 |
| 40 | Vanderweil Engineers | 808,300 |
| 41 | Karpinski Engineering | 720,037 |
| 42 | Sparling | 682,833 |
| 43 | Martin/Martin | 674,166 |
| 44 | SSOE Group | 664,516 |
| 45 | RMF Engineering | 650,000 |
| 46 | Aon Fire Protection Engineering Corp. | 540,000 |
| 47 | Newcomb & Boyd | 534,136 |
| 48 | Environmental Systems Design | 521,731 |
| 49 | Guernsey | 502,819 |
| 50 | I. C. Thomasson Associates | 500,000 |
| 51 | G&W Engineering Corp. | 484,000 |
| 52 | Wick Fisher White | 446,553 |
| 53 | Arup | 431,084 |
| 54 | CTLGroup | 400,000 |
| 55 | OLA Consulting Engineers | 308,400 |
| 56 | Kamm Consulting | 286,426 |
| 57 | DeSimone Consulting Engineers | 262,015 |
| 58 | GRW | 189,200 |
| 59 | Zak Companies | 178,364 |
| 60 | Dunham Associates | 150,000 |
| 61 | Mazzetti | 149,031 |
| 62 | Davis, Bowen & Friedel | 132,028 |
| 63 | Affiliated Engineers | 112,000 |
| 64 | Spectrum Engineers | 93,110 |
| 65 | Magnusson Klemencic Associates | 76,069 |
Top K-12 School Sector Construction Firms
| Rank | Company | 2013 K-12 Revenue |
| 1 | Gilbane | $480,230,252 |
| 2 | Turner Construction | 419,619,000 |
| 3 | Balfour Beatty US | 372,288,885 |
| 4 | CORE Construction Group | 278,177,865 |
| 5 | Skanska USA | 212,802,648 |
| 6 | Swinerton Builders | 182,000,000 |
| 7 | Kraus-Anderson Construction | 181,000,000 |
| 8 | JE Dunn Construction | 167,798,654 |
| 9 | Consigli Construction | 151,997,147 |
| 10 | Whiting-Turner Contracting Co., The | 146,933,150 |
| 11 | Adolfson & Peterson Construction | 142,957,713 |
| 12 | Barton Malow | 142,524,833 |
| 13 | McCarthy Holdings | 140,400,000 |
| 14 | PCL Construction | 122,996,983 |
| 15 | Tutor Perini Corp. | 120,049,254 |
| 16 | McShane Companies, The | 118,124,887 |
| 17 | Flintco | 110,350,000 |
| 18 | KBE Building Corp. | 89,239,714 |
| 19 | Bernards | 85,000,000 |
| 20 | Sundt Construction | 69,522,647 |
| 21 | Absher Construction | 67,476,142 |
| 22 | LeChase Construction Services | 65,600,000 |
| 23 | Walsh Group, The | 62,965,887 |
| 24 | Wight & Company | 61,092,000 |
| 25 | Lend Lease | 59,255,000 |
| 26 | Haselden Construction | 55,166,396 |
| 27 | LPCiminelli | 54,810,831 |
| 28 | Shawmut Design and Construction | 51,000,000 |
| 29 | Ryan Companies US | 48,316,285 |
| 30 | URS Corp. | 47,642,239 |
| 31 | Yates Companies, The | 42,800,000 |
| 32 | Pepper Construction | 35,760,000 |
| 33 | C.W. Driver | 35,595,000 |
| 34 | E.W. Howell | 33,818,000 |
| 35 | Coakley & Williams Construction | 32,267,167 |
| 36 | Brasfield & Gorrie | 30,364,402 |
| 37 | Choate Construction | 30,237,395 |
| 38 | Bette Companies, The | 29,375,000 |
| 39 | S. M. Wilson & Co. | 25,725,568 |
| 40 | Suffolk Construction | 25,620,266 |
| 41 | EMJ Corp. | 24,000,000 |
| 42 | Parsons Brinckerhoff | 20,057,993 |
| 43 | Manhattan Construction | 19,124,000 |
| 44 | New South Construction | 17,650,000 |
| 45 | Hill & Wilkinson | 17,026,000 |
| 46 | Kitchell Corp. | 16,545,918 |
| 47 | Heery International | 14,994,535 |
| 48 | HITT Contracting | 14,900,000 |
| 49 | Robins & Morton | 13,176,447 |
| 50 | W. M. Jordan Company | 12,735,471 |
| 51 | Messer Construction | 12,453,591 |
| 52 | Structure Tone | 12,081,000 |
| 53 | Hill International | 12,000,000 |
| 54 | Boldt Company, The | 11,978,048 |
| 55 | Hathaway Dinwiddie Construction | 11,690,000 |
| 56 | James G. Davis Construction | 10,187,161 |
| 57 | Stalco Construction | 10,040,000 |
| 58 | STV | 8,018,000 |
| 59 | Hunt Construction Group | 7,000,000 |
| 60 | O'Neil Industries/W.E. O'Neil | 5,825,412 |
| 61 | Weis Builders | 3,389,000 |
| 62 | Beck Group, The | 3,117,539 |
| 63 | Allen & Shariff | 3,000,000 |
| 64 | Linbeck Group | 2,590,000 |
| 65 | Batson-Cook | 1,810,861 |
| 66 | Hoar Construction | 1,769,000 |
| 67 | Clark Group | 1,731,296 |
| 68 | James McHugh Construction | 1,460,905 |
| 69 | Weitz Company, The | 1,434,533 |
| 70 | IMC Construction | 1,433,690 |
| 71 | Astorino | 743,040 |
| 72 | JLL | 242,655 |
Read BD+C's full 2014 Giants 300 Report
Related Stories

Multifamily Housing | Apr 5, 2022
New Covenant House New York contains multiple services for youth in crisis
The new Covenant House New York, a crisis shelter for homeless youth in the Hell’s Kitchen neighborhood, provides a temporary home and multiple services for young people.
Sponsored | BD+C University Course | Apr 1, 2022
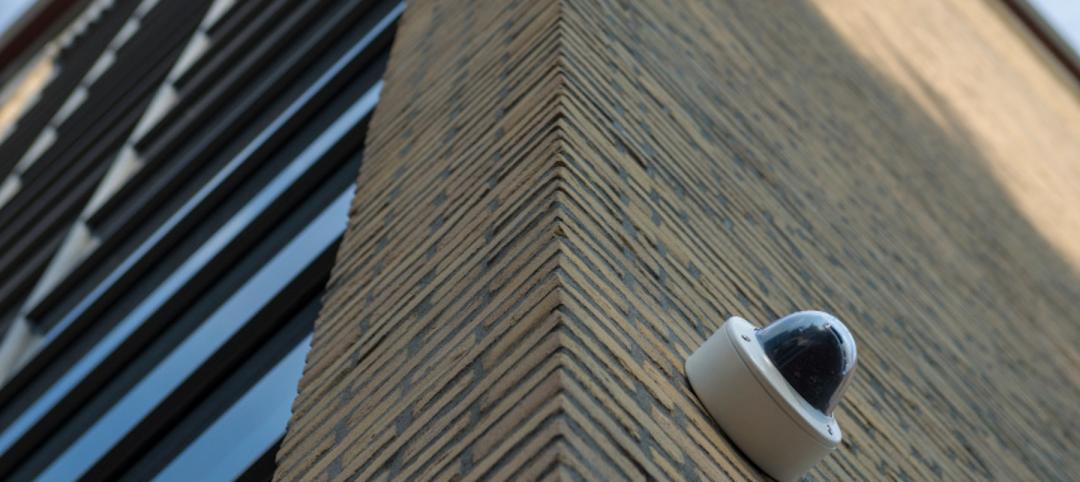
Video surveillance systems for multifamily housing projects
This introductory course provides detailed technical information and advice from security expert Michael Silva, CPP, on designing a video surveillance system for multifamily housing communities – apartments, condominiums, townhouses, or senior living communities. Technical advice on choosing the right type of cameras and optimizing the exterior lighting for their use is offered.

K-12 Schools | Apr 1, 2022
Charleston County’s award-winning career and technical education high school
BD+C Executive Editor Rob Cassidy talks with the team behind the award-winning Cooper River Center for Advanced Studies, a Career|Technical Education high school in Charleston County, S.C.

Modular Building | Mar 31, 2022
Rick Murdock’s dream multifamily housing factory
Modular housing leader Rick Murdock had a vision: Why not use robotic systems to automate the production of affordable modular housing? Now that vision is a reality.

Multifamily Housing | Mar 29, 2022
Here’s why the U.S. needs more ‘TOD’ housing
Transit-oriented developments help address the housing affordability issue that many cities and suburbs are facing.

Contractors | Mar 28, 2022
Amid supply chain woes, building teams employ extreme procurement measures
Project teams are looking to eliminate much of the guesswork around product availability and price inflation by employing early bulk-purchasing measures for entire building projects.

Reconstruction & Renovation | Mar 28, 2022
Is your firm a reconstruction sector giant?
Is your firm active in the U.S. building reconstruction, renovation, historic preservation, and adaptive reuse markets? We invite you to participate in BD+C's inaugural Reconstruction Market Research Report.

Legislation | Mar 28, 2022
LEED Platinum office tower faces millions in fines due to New York’s Local Law 97
One Bryant Park, also known as the Bank of America Tower, in Manhattan faces an estimated $2.4 million in annual fines when New York City’s York’s Local Law 97 goes into effect.

Healthcare Facilities | Mar 25, 2022
Health group converts bank building to drive-thru clinic
Edward-Elmhurst Health and JTS Architects had to get creative when turning an American Chartered Bank into a drive-thru clinic for outpatient testing and vaccinations.

Higher Education | Mar 24, 2022
Higher education sector sees 19 percent reduction in facilities investments
Colleges and universities face a growing backlog of capital needs and funding shortfalls, according to Gordian’s 2022 State of Facilities in Higher Education report.


