


After a long period of anemic performance, with growth mostly driven by renovations and additions, the K-12 sector is showing renewed interest in new construction. Consultant Paul Abramson, using data from Dun & Bradstreet, calculates that districts spent about $13.4 billion on construction projects in 2013, about $7.6 billion of which went for new schools (http://bit.ly/1kN4qkv).
Highest-spending regions included Texas-Louisiana-Oklahoma-Arkansas ($2.3 billion, or 17% of the nation’s K-12 total) and Arizona-California-Hawaii-Nevada ($1.68 billion). The lowest-spending regions included debt-plagued Illinois with neighboring states Minnesota and Wisconsin ($651 million) and Alaska-Idaho-Oregon-Washington ($558 million).
High schools are outpacing other K-12 facilities in construction spending, with the dollar value of projected 2014 starts at $4.15 billion, or 44% of the K-12 total. That’s followed by 33% for elementary schools, 23% for middle schools, and <1% for administrative and support projects.
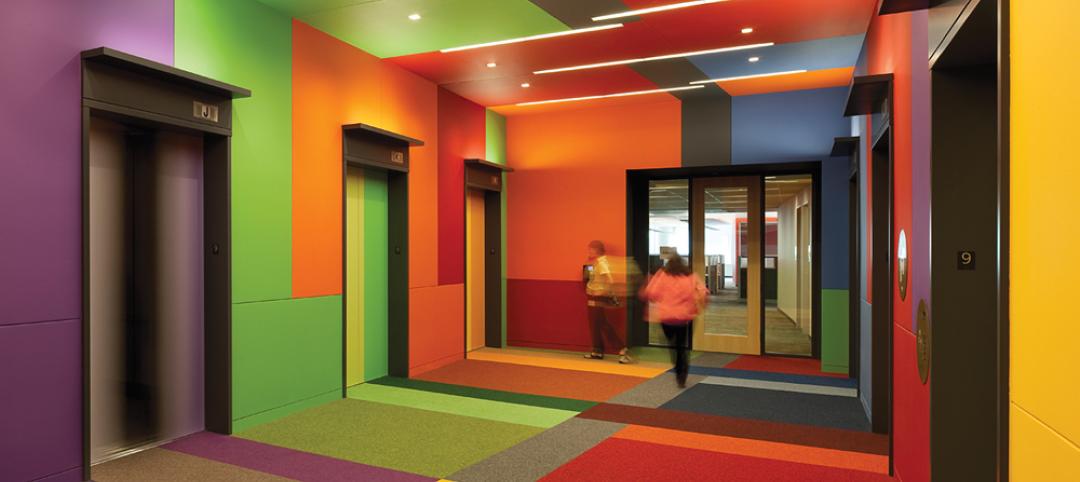
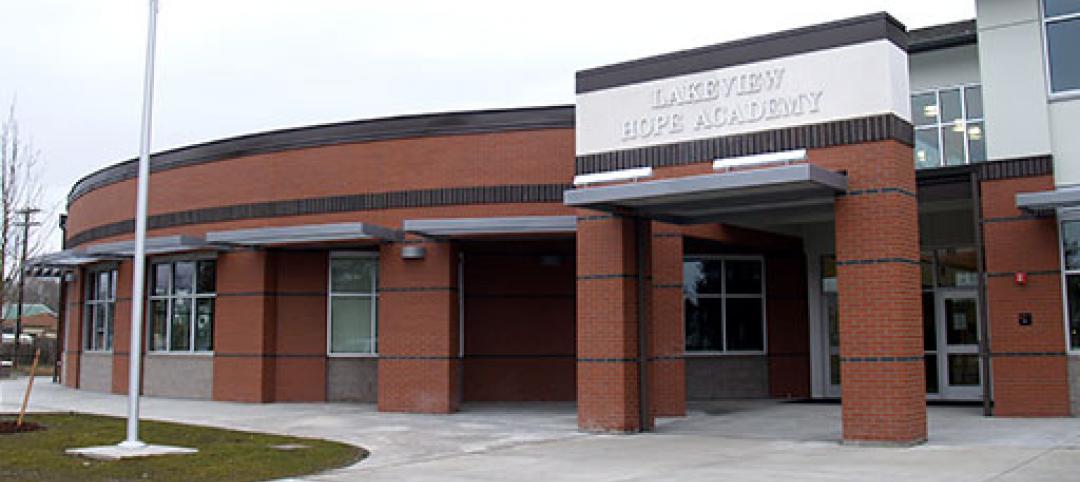
Among the evident design trends: STEM morphing into STEAM with the addition of arts enrichment (sometimes with professional-quality performance spaces) to science, technology, engineering, and math schools; growing enthusiasm for vocational training facilities that provide an alternative to the traditional college prep path; and schools that do a better job of cementing community connections by leveraging local architectural themes.
The push for sustainable K-12 facilities also marches on; at high levels of green, the theme typically suffuses the pedagogy. Hood River (Ore.) Middle School’s Music and Science Building was recently certified net-zero energy by the International Living Future Institute, making it the first public school building to earn the tough-to-achieve designation.
Top K-12 School Sector Architecture Firms
| Rank | Company | 2013 K-12 Revenue |
| 1 | DLR Group | $41,000,000 |
| 2 | SHW Group | 40,016,000 |
| 3 | PBK | 35,880,000 |
| 4 | HMC Architects | 26,097,082 |
| 5 | Fanning/Howey Associates | 17,877,000 |
| 6 | Perkins+will | 16,668,514 |
| 7 | Heery International | 14,994,535 |
| 8 | NAC|Architecture | 14,494,206 |
| 9 | LPA | 14,191,442 |
| 10 | Perkins Eastman | 13,950,000 |
| 11 | Quattrocchi Kwok Architects | 13,230,000 |
| 12 | Moseley Architects | 12,521,613 |
| 13 | Integrus Architecture | 12,229,858 |
| 14 | Corgan | 10,372,178 |
| 15 | FGM Architects | 9,846,977 |
| 16 | NTD Architecture | 9,200,000 |
| 17 | Parkhill, Smith & Cooper | 8,580,000 |
| 18 | Symmes Maini & McKee Associates | 8,375,000 |
| 19 | Stantec | 8,097,800 |
| 20 | SchenkelShultz Architecture | 7,880,000 |
| 21 | SEI Design Group | 7,566,000 |
| 22 | Slaterpaull Architects | 7,500,468 |
| 23 | DLA Architects | 7,255,830 |
| 24 | GWWO | 7,047,216 |
| 25 | BRPH | 6,681,000 |
| 26 | Legat Architects | 6,630,200 |
| 27 | Wight & Company | 6,579,000 |
| 28 | Ashley McGraw Architects | 6,093,874 |
| 29 | HMFH Architects | 6,032,607 |
| 30 | BBS Architects | 5,950,250 |
| 31 | BLDD Architects | 5,750,000 |
| 32 | LaBella Associates | 5,644,772 |
| 33 | LS3P | 5,155,547 |
| 34 | Eppstein Uhen Architects | 4,623,477 |
| 35 | H+L Architecture | 4,070,997 |
| 36 | EwingCole | 4,020,000 |
| 37 | FXFOWLE Architects | 3,940,000 |
| 38 | Harley Ellis Devereaux | 3,780,000 |
| 39 | Cooper Carry | 3,402,330 |
| 40 | Goodwyn Mills & Cawood | 3,399,167 |
| 41 | CTA Architects Engineers | 3,336,600 |
| 42 | HKS | 3,142,143 |
| 43 | Cuningham Group Architecture | 3,052,272 |
| 44 | Schrader Group Architecture | 3,047,414 |
| 45 | NORR | 2,976,836 |
| 46 | Hord Coplan Macht | 2,948,595 |
| 47 | Ratio Architects | 2,879,009 |
| 48 | Albert Kahn Associates | 2,775,253 |
| 49 | IBI Group ? Gruzen Samton | 2,500,000 |
| 50 | RS&H | 2,450,000 |
| 51 | Harvard Jolly Architecture | 2,097,387 |
| 52 | Shepley Bulfinch | 2,000,000 |
| 53 | Becker Morgan Group | 1,945,649 |
| 54 | Leo A Daly | 1,787,681 |
| 55 | Good Fulton & Farrell | 1,704,900 |
| 56 | KZF Design | 1,490,333 |
| 57 | Clark Nexsen | 1,441,748 |
| 58 | Little | 1,410,229 |
| 59 | LMN Architects | 1,223,400 |
| 60 | Smallwood, Reynolds, Stewart, Stewart & Associates | 1,213,567 |
| 61 | Environetics | 1,137,965 |
| 62 | Massa Montalto Architects | 1,056,000 |
| 63 | VOA Associates | 989,711 |
| 64 | Mithun | 930,000 |
| 65 | Gensler | 700,000 |
| 66 | WHR Architects | 699,316 |
| 67 | PGAL | 672,000 |
| 68 | Ennead Architects | 585,055 |
| 69 | Davis Brody Bond | 570,932 |
| 70 | DesignGroup | 538,710 |
| 71 | OZ Architecture | 487,900 |
| 72 | Kirksey | 466,989 |
| 73 | HNTB Corp. | 444,786 |
| 74 | Beyer Blinder Belle | 405,394 |
| 75 | CO Architects | 386,900 |
| 76 | RSP Architects | 377,000 |
| 77 | LawKingdon Architecture | 350,000 |
| 78 | Ziegler Cooper | 348,762 |
| 79 | Morris Architects | 335,000 |
| 80 | Rule Joy Trammell + Rubio | 320,000 |
| 81 | Cambridge Seven Associates | 305,000 |
| 82 | Ware Malcomb | 284,000 |
| 83 | Hoffmann Architects | 260,000 |
| 84 | CASCO Diversified Corp. | 250,000 |
| 85 | JRS Architect | 235,000 |
| 86 | Rosser International | 230,000 |
| 87 | Page | 229,000 |
| 88 | Nelson | 210,577 |
| 89 | Gresham, Smith and Partners | 200,000 |
| 90 | Hastings+Chivetta Architects | 169,568 |
| 91 | Nadel | 130,000 |
| 92 | Epstein | 108,000 |
| 93 | BSA LifeStructures | 106,426 |
| 94 | ATA Beilharz Architects | 104,525 |
| 95 | Niles Bolton Associates | 104,386 |
| 96 | Hensley Lamkin Rachel | 100,000 |
| 97 | GBBN Architects | 97,000 |
| 98 | Sherlock, Smith & Adams | 92,000 |
| 99 | Lord Aeck Sargent | 75,379 |
| 100 | Poskanzer Skott | 50,000 |
| 101 | TEG Architects | 11,928 |
Top K-12 School Sector Engineering Firms
| Rank | Company | 2013 K-12 Revenue |
| 1 | AECOM Technology Corp. | $50,930,000 |
| 2 | URS Corp. | 47,642,239 |
| 3 | Jacobs | 35,150,000 |
| 4 | Parsons Brinckerhoff | 20,057,993 |
| 5 | TTG | 12,352,642 |
| 6 | STV | 8,018,000 |
| 7 | Shive-Hattery | 5,975,671 |
| 8 | KCI Technologies | 4,800,000 |
| 9 | Dewberry | 4,340,398 |
| 10 | Joseph R. Loring & Associates | 4,300,000 |
| 11 | Heapy Engineering | 4,079,921 |
| 12 | Thornton Tomasetti | 3,617,144 |
| 13 | Wiss, Janney, Elstner Associates | 3,380,000 |
| 14 | Allen & Shariff | 3,000,000 |
| 15 | Interface Engineering | 2,934,922 |
| 16 | KJWW Engineering Consultants | 2,878,919 |
| 17 | Paulus, Sokolowski and Sartor | 2,800,000 |
| 18 | Brinjac Engineering | 2,677,720 |
| 19 | Simpson Gumpertz & Heger | 2,610,000 |
| 20 | M/E Engineering | 2,531,610 |
| 21 | Primera Engineers | 2,357,000 |
| 22 | French & Parrello Associates | 2,297,300 |
| 23 | Coffman Engineers | 2,147,260 |
| 24 | Henderson Engineers | 2,103,903 |
| 25 | Bridgers & Paxton Consulting Engineers | 2,024,344 |
| 26 | RDK Engineers | 1,880,000 |
| 27 | Wallace Engineering | 1,691,000 |
| 28 | KPFF Consulting Engineers | 1,625,000 |
| 29 | H.F. Lenz | 1,619,250 |
| 30 | Highland Associates | 1,600,000 |
| 31 | KLH Engineers | 1,384,045 |
| 32 | Glumac | 1,306,149 |
| 33 | AKF Group | 1,299,000 |
| 34 | Rist-Frost-Shumway Engineering | 1,000,000 |
| 35 | Fishbeck, Thompson, Carr & Huber | 1,000,000 |
| 36 | CJL Engineering | 994,410 |
| 37 | TLC Engineering for Architecture | 967,161 |
| 38 | M-E Engineers | 966,000 |
| 39 | Walter P Moore and Associates | 937,062 |
| 40 | Vanderweil Engineers | 808,300 |
| 41 | Karpinski Engineering | 720,037 |
| 42 | Sparling | 682,833 |
| 43 | Martin/Martin | 674,166 |
| 44 | SSOE Group | 664,516 |
| 45 | RMF Engineering | 650,000 |
| 46 | Aon Fire Protection Engineering Corp. | 540,000 |
| 47 | Newcomb & Boyd | 534,136 |
| 48 | Environmental Systems Design | 521,731 |
| 49 | Guernsey | 502,819 |
| 50 | I. C. Thomasson Associates | 500,000 |
| 51 | G&W Engineering Corp. | 484,000 |
| 52 | Wick Fisher White | 446,553 |
| 53 | Arup | 431,084 |
| 54 | CTLGroup | 400,000 |
| 55 | OLA Consulting Engineers | 308,400 |
| 56 | Kamm Consulting | 286,426 |
| 57 | DeSimone Consulting Engineers | 262,015 |
| 58 | GRW | 189,200 |
| 59 | Zak Companies | 178,364 |
| 60 | Dunham Associates | 150,000 |
| 61 | Mazzetti | 149,031 |
| 62 | Davis, Bowen & Friedel | 132,028 |
| 63 | Affiliated Engineers | 112,000 |
| 64 | Spectrum Engineers | 93,110 |
| 65 | Magnusson Klemencic Associates | 76,069 |
Top K-12 School Sector Construction Firms
| Rank | Company | 2013 K-12 Revenue |
| 1 | Gilbane | $480,230,252 |
| 2 | Turner Construction | 419,619,000 |
| 3 | Balfour Beatty US | 372,288,885 |
| 4 | CORE Construction Group | 278,177,865 |
| 5 | Skanska USA | 212,802,648 |
| 6 | Swinerton Builders | 182,000,000 |
| 7 | Kraus-Anderson Construction | 181,000,000 |
| 8 | JE Dunn Construction | 167,798,654 |
| 9 | Consigli Construction | 151,997,147 |
| 10 | Whiting-Turner Contracting Co., The | 146,933,150 |
| 11 | Adolfson & Peterson Construction | 142,957,713 |
| 12 | Barton Malow | 142,524,833 |
| 13 | McCarthy Holdings | 140,400,000 |
| 14 | PCL Construction | 122,996,983 |
| 15 | Tutor Perini Corp. | 120,049,254 |
| 16 | McShane Companies, The | 118,124,887 |
| 17 | Flintco | 110,350,000 |
| 18 | KBE Building Corp. | 89,239,714 |
| 19 | Bernards | 85,000,000 |
| 20 | Sundt Construction | 69,522,647 |
| 21 | Absher Construction | 67,476,142 |
| 22 | LeChase Construction Services | 65,600,000 |
| 23 | Walsh Group, The | 62,965,887 |
| 24 | Wight & Company | 61,092,000 |
| 25 | Lend Lease | 59,255,000 |
| 26 | Haselden Construction | 55,166,396 |
| 27 | LPCiminelli | 54,810,831 |
| 28 | Shawmut Design and Construction | 51,000,000 |
| 29 | Ryan Companies US | 48,316,285 |
| 30 | URS Corp. | 47,642,239 |
| 31 | Yates Companies, The | 42,800,000 |
| 32 | Pepper Construction | 35,760,000 |
| 33 | C.W. Driver | 35,595,000 |
| 34 | E.W. Howell | 33,818,000 |
| 35 | Coakley & Williams Construction | 32,267,167 |
| 36 | Brasfield & Gorrie | 30,364,402 |
| 37 | Choate Construction | 30,237,395 |
| 38 | Bette Companies, The | 29,375,000 |
| 39 | S. M. Wilson & Co. | 25,725,568 |
| 40 | Suffolk Construction | 25,620,266 |
| 41 | EMJ Corp. | 24,000,000 |
| 42 | Parsons Brinckerhoff | 20,057,993 |
| 43 | Manhattan Construction | 19,124,000 |
| 44 | New South Construction | 17,650,000 |
| 45 | Hill & Wilkinson | 17,026,000 |
| 46 | Kitchell Corp. | 16,545,918 |
| 47 | Heery International | 14,994,535 |
| 48 | HITT Contracting | 14,900,000 |
| 49 | Robins & Morton | 13,176,447 |
| 50 | W. M. Jordan Company | 12,735,471 |
| 51 | Messer Construction | 12,453,591 |
| 52 | Structure Tone | 12,081,000 |
| 53 | Hill International | 12,000,000 |
| 54 | Boldt Company, The | 11,978,048 |
| 55 | Hathaway Dinwiddie Construction | 11,690,000 |
| 56 | James G. Davis Construction | 10,187,161 |
| 57 | Stalco Construction | 10,040,000 |
| 58 | STV | 8,018,000 |
| 59 | Hunt Construction Group | 7,000,000 |
| 60 | O'Neil Industries/W.E. O'Neil | 5,825,412 |
| 61 | Weis Builders | 3,389,000 |
| 62 | Beck Group, The | 3,117,539 |
| 63 | Allen & Shariff | 3,000,000 |
| 64 | Linbeck Group | 2,590,000 |
| 65 | Batson-Cook | 1,810,861 |
| 66 | Hoar Construction | 1,769,000 |
| 67 | Clark Group | 1,731,296 |
| 68 | James McHugh Construction | 1,460,905 |
| 69 | Weitz Company, The | 1,434,533 |
| 70 | IMC Construction | 1,433,690 |
| 71 | Astorino | 743,040 |
| 72 | JLL | 242,655 |
Read BD+C's full 2014 Giants 300 Report
Related Stories

| May 16, 2013
Chicago unveils $1.1 billion plan for DePaul arena, Navy Pier upgrades
Hoping to send a loud message that Chicago is serious about luring tourism and entertainment spending, Mayor Rahm Emanuel has released details of two initiatives that have been developing for more than a year and that it says will mean $1.1 billion in investment in the McCormick Place and Navy Pier areas.

| May 16, 2013
Michael R. Bohn named Executive VP at Gilbane
Gilbane has promoted Michael R. Bohn to executive vice president. With over 28 years of service to the company and leadership roles on such high-profile projects as the University of Michigan Biomedical Science Building and the University of Chicago Medical Center, Bohn will now have responsibility for Gilbane’s New York and Midwest business units.


| May 15, 2013
Schneider Electric announces Global Xperience Efficiency Events for 2013
Schneider Electric’s Xperience Efficiency series will begin with events in the United States, China, Colombia, Brazil and Russia.

| May 15, 2013
Center for Green Schools, Architecture for Humanity release new tool for green schools
The 70-page guide demystifies the processes of identifying building improvement opportunities and finance and implementation strategies.
| May 14, 2013
Paints and coatings: The latest trends in sustainability
When it comes to durability, a 50-year building design ideally should include 50-year coatings. Many building products consume substantial amounts of energy, water, and petrochemicals during manufacture, but they can make up for it in the operations phase. The same should be expected from architectural coatings.

| May 14, 2013
Advanced turbines generate 6X more energy than conventional models
US-based wind energy company SheerWind just unveiled the INVELOX – a tunnel-based wind turbine that can produce up to 600% more power than traditional wind turbines.

| May 14, 2013
Raymond Clark joins HOK’s Chicago Practice as Management Principal
HOK announced today that Raymond Clark, AIA, LEED AP, has joined its leadership team in Chicago as senior vice president and management principal.
| May 14, 2013
Easy net-zero energy buildings [infographic]
"Be a Zero Hero" infographic educates building industry professionals on ultra energy-efficient structural insulated panel construction
| May 9, 2013
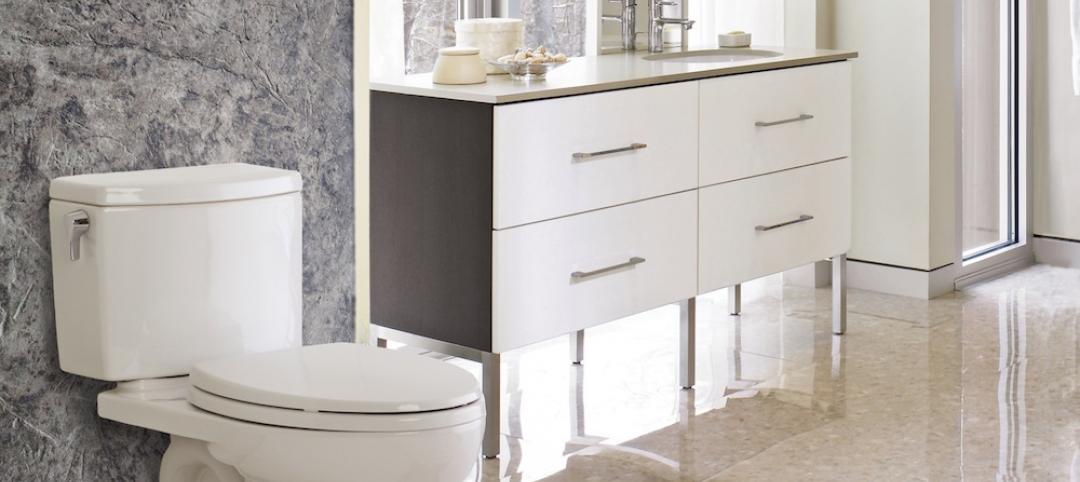
10 high-efficiency plumbing fixtures
From a "no sweat" toilet to a deep-well lavatory, here's a round up of the latest high-efficiency plumbing fixtures.


