


After a long period of anemic performance, with growth mostly driven by renovations and additions, the K-12 sector is showing renewed interest in new construction. Consultant Paul Abramson, using data from Dun & Bradstreet, calculates that districts spent about $13.4 billion on construction projects in 2013, about $7.6 billion of which went for new schools (http://bit.ly/1kN4qkv).
Highest-spending regions included Texas-Louisiana-Oklahoma-Arkansas ($2.3 billion, or 17% of the nation’s K-12 total) and Arizona-California-Hawaii-Nevada ($1.68 billion). The lowest-spending regions included debt-plagued Illinois with neighboring states Minnesota and Wisconsin ($651 million) and Alaska-Idaho-Oregon-Washington ($558 million).
High schools are outpacing other K-12 facilities in construction spending, with the dollar value of projected 2014 starts at $4.15 billion, or 44% of the K-12 total. That’s followed by 33% for elementary schools, 23% for middle schools, and <1% for administrative and support projects.
Among the evident design trends: STEM morphing into STEAM with the addition of arts enrichment (sometimes with professional-quality performance spaces) to science, technology, engineering, and math schools; growing enthusiasm for vocational training facilities that provide an alternative to the traditional college prep path; and schools that do a better job of cementing community connections by leveraging local architectural themes.
The push for sustainable K-12 facilities also marches on; at high levels of green, the theme typically suffuses the pedagogy. Hood River (Ore.) Middle School’s Music and Science Building was recently certified net-zero energy by the International Living Future Institute, making it the first public school building to earn the tough-to-achieve designation.
Top K-12 School Sector Architecture Firms
| Rank | Company | 2013 K-12 Revenue |
| 1 | DLR Group | $41,000,000 |
| 2 | SHW Group | 40,016,000 |
| 3 | PBK | 35,880,000 |
| 4 | HMC Architects | 26,097,082 |
| 5 | Fanning/Howey Associates | 17,877,000 |
| 6 | Perkins+will | 16,668,514 |
| 7 | Heery International | 14,994,535 |
| 8 | NAC|Architecture | 14,494,206 |
| 9 | LPA | 14,191,442 |
| 10 | Perkins Eastman | 13,950,000 |
| 11 | Quattrocchi Kwok Architects | 13,230,000 |
| 12 | Moseley Architects | 12,521,613 |
| 13 | Integrus Architecture | 12,229,858 |
| 14 | Corgan | 10,372,178 |
| 15 | FGM Architects | 9,846,977 |
| 16 | NTD Architecture | 9,200,000 |
| 17 | Parkhill, Smith & Cooper | 8,580,000 |
| 18 | Symmes Maini & McKee Associates | 8,375,000 |
| 19 | Stantec | 8,097,800 |
| 20 | SchenkelShultz Architecture | 7,880,000 |
| 21 | SEI Design Group | 7,566,000 |
| 22 | Slaterpaull Architects | 7,500,468 |
| 23 | DLA Architects | 7,255,830 |
| 24 | GWWO | 7,047,216 |
| 25 | BRPH | 6,681,000 |
| 26 | Legat Architects | 6,630,200 |
| 27 | Wight & Company | 6,579,000 |
| 28 | Ashley McGraw Architects | 6,093,874 |
| 29 | HMFH Architects | 6,032,607 |
| 30 | BBS Architects | 5,950,250 |
| 31 | BLDD Architects | 5,750,000 |
| 32 | LaBella Associates | 5,644,772 |
| 33 | LS3P | 5,155,547 |
| 34 | Eppstein Uhen Architects | 4,623,477 |
| 35 | H+L Architecture | 4,070,997 |
| 36 | EwingCole | 4,020,000 |
| 37 | FXFOWLE Architects | 3,940,000 |
| 38 | Harley Ellis Devereaux | 3,780,000 |
| 39 | Cooper Carry | 3,402,330 |
| 40 | Goodwyn Mills & Cawood | 3,399,167 |
| 41 | CTA Architects Engineers | 3,336,600 |
| 42 | HKS | 3,142,143 |
| 43 | Cuningham Group Architecture | 3,052,272 |
| 44 | Schrader Group Architecture | 3,047,414 |
| 45 | NORR | 2,976,836 |
| 46 | Hord Coplan Macht | 2,948,595 |
| 47 | Ratio Architects | 2,879,009 |
| 48 | Albert Kahn Associates | 2,775,253 |
| 49 | IBI Group ? Gruzen Samton | 2,500,000 |
| 50 | RS&H | 2,450,000 |
| 51 | Harvard Jolly Architecture | 2,097,387 |
| 52 | Shepley Bulfinch | 2,000,000 |
| 53 | Becker Morgan Group | 1,945,649 |
| 54 | Leo A Daly | 1,787,681 |
| 55 | Good Fulton & Farrell | 1,704,900 |
| 56 | KZF Design | 1,490,333 |
| 57 | Clark Nexsen | 1,441,748 |
| 58 | Little | 1,410,229 |
| 59 | LMN Architects | 1,223,400 |
| 60 | Smallwood, Reynolds, Stewart, Stewart & Associates | 1,213,567 |
| 61 | Environetics | 1,137,965 |
| 62 | Massa Montalto Architects | 1,056,000 |
| 63 | VOA Associates | 989,711 |
| 64 | Mithun | 930,000 |
| 65 | Gensler | 700,000 |
| 66 | WHR Architects | 699,316 |
| 67 | PGAL | 672,000 |
| 68 | Ennead Architects | 585,055 |
| 69 | Davis Brody Bond | 570,932 |
| 70 | DesignGroup | 538,710 |
| 71 | OZ Architecture | 487,900 |
| 72 | Kirksey | 466,989 |
| 73 | HNTB Corp. | 444,786 |
| 74 | Beyer Blinder Belle | 405,394 |
| 75 | CO Architects | 386,900 |
| 76 | RSP Architects | 377,000 |
| 77 | LawKingdon Architecture | 350,000 |
| 78 | Ziegler Cooper | 348,762 |
| 79 | Morris Architects | 335,000 |
| 80 | Rule Joy Trammell + Rubio | 320,000 |
| 81 | Cambridge Seven Associates | 305,000 |
| 82 | Ware Malcomb | 284,000 |
| 83 | Hoffmann Architects | 260,000 |
| 84 | CASCO Diversified Corp. | 250,000 |
| 85 | JRS Architect | 235,000 |
| 86 | Rosser International | 230,000 |
| 87 | Page | 229,000 |
| 88 | Nelson | 210,577 |
| 89 | Gresham, Smith and Partners | 200,000 |
| 90 | Hastings+Chivetta Architects | 169,568 |
| 91 | Nadel | 130,000 |
| 92 | Epstein | 108,000 |
| 93 | BSA LifeStructures | 106,426 |
| 94 | ATA Beilharz Architects | 104,525 |
| 95 | Niles Bolton Associates | 104,386 |
| 96 | Hensley Lamkin Rachel | 100,000 |
| 97 | GBBN Architects | 97,000 |
| 98 | Sherlock, Smith & Adams | 92,000 |
| 99 | Lord Aeck Sargent | 75,379 |
| 100 | Poskanzer Skott | 50,000 |
| 101 | TEG Architects | 11,928 |
Top K-12 School Sector Engineering Firms
| Rank | Company | 2013 K-12 Revenue |
| 1 | AECOM Technology Corp. | $50,930,000 |
| 2 | URS Corp. | 47,642,239 |
| 3 | Jacobs | 35,150,000 |
| 4 | Parsons Brinckerhoff | 20,057,993 |
| 5 | TTG | 12,352,642 |
| 6 | STV | 8,018,000 |
| 7 | Shive-Hattery | 5,975,671 |
| 8 | KCI Technologies | 4,800,000 |
| 9 | Dewberry | 4,340,398 |
| 10 | Joseph R. Loring & Associates | 4,300,000 |
| 11 | Heapy Engineering | 4,079,921 |
| 12 | Thornton Tomasetti | 3,617,144 |
| 13 | Wiss, Janney, Elstner Associates | 3,380,000 |
| 14 | Allen & Shariff | 3,000,000 |
| 15 | Interface Engineering | 2,934,922 |
| 16 | KJWW Engineering Consultants | 2,878,919 |
| 17 | Paulus, Sokolowski and Sartor | 2,800,000 |
| 18 | Brinjac Engineering | 2,677,720 |
| 19 | Simpson Gumpertz & Heger | 2,610,000 |
| 20 | M/E Engineering | 2,531,610 |
| 21 | Primera Engineers | 2,357,000 |
| 22 | French & Parrello Associates | 2,297,300 |
| 23 | Coffman Engineers | 2,147,260 |
| 24 | Henderson Engineers | 2,103,903 |
| 25 | Bridgers & Paxton Consulting Engineers | 2,024,344 |
| 26 | RDK Engineers | 1,880,000 |
| 27 | Wallace Engineering | 1,691,000 |
| 28 | KPFF Consulting Engineers | 1,625,000 |
| 29 | H.F. Lenz | 1,619,250 |
| 30 | Highland Associates | 1,600,000 |
| 31 | KLH Engineers | 1,384,045 |
| 32 | Glumac | 1,306,149 |
| 33 | AKF Group | 1,299,000 |
| 34 | Rist-Frost-Shumway Engineering | 1,000,000 |
| 35 | Fishbeck, Thompson, Carr & Huber | 1,000,000 |
| 36 | CJL Engineering | 994,410 |
| 37 | TLC Engineering for Architecture | 967,161 |
| 38 | M-E Engineers | 966,000 |
| 39 | Walter P Moore and Associates | 937,062 |
| 40 | Vanderweil Engineers | 808,300 |
| 41 | Karpinski Engineering | 720,037 |
| 42 | Sparling | 682,833 |
| 43 | Martin/Martin | 674,166 |
| 44 | SSOE Group | 664,516 |
| 45 | RMF Engineering | 650,000 |
| 46 | Aon Fire Protection Engineering Corp. | 540,000 |
| 47 | Newcomb & Boyd | 534,136 |
| 48 | Environmental Systems Design | 521,731 |
| 49 | Guernsey | 502,819 |
| 50 | I. C. Thomasson Associates | 500,000 |
| 51 | G&W Engineering Corp. | 484,000 |
| 52 | Wick Fisher White | 446,553 |
| 53 | Arup | 431,084 |
| 54 | CTLGroup | 400,000 |
| 55 | OLA Consulting Engineers | 308,400 |
| 56 | Kamm Consulting | 286,426 |
| 57 | DeSimone Consulting Engineers | 262,015 |
| 58 | GRW | 189,200 |
| 59 | Zak Companies | 178,364 |
| 60 | Dunham Associates | 150,000 |
| 61 | Mazzetti | 149,031 |
| 62 | Davis, Bowen & Friedel | 132,028 |
| 63 | Affiliated Engineers | 112,000 |
| 64 | Spectrum Engineers | 93,110 |
| 65 | Magnusson Klemencic Associates | 76,069 |
Top K-12 School Sector Construction Firms
| Rank | Company | 2013 K-12 Revenue |
| 1 | Gilbane | $480,230,252 |
| 2 | Turner Construction | 419,619,000 |
| 3 | Balfour Beatty US | 372,288,885 |
| 4 | CORE Construction Group | 278,177,865 |
| 5 | Skanska USA | 212,802,648 |
| 6 | Swinerton Builders | 182,000,000 |
| 7 | Kraus-Anderson Construction | 181,000,000 |
| 8 | JE Dunn Construction | 167,798,654 |
| 9 | Consigli Construction | 151,997,147 |
| 10 | Whiting-Turner Contracting Co., The | 146,933,150 |
| 11 | Adolfson & Peterson Construction | 142,957,713 |
| 12 | Barton Malow | 142,524,833 |
| 13 | McCarthy Holdings | 140,400,000 |
| 14 | PCL Construction | 122,996,983 |
| 15 | Tutor Perini Corp. | 120,049,254 |
| 16 | McShane Companies, The | 118,124,887 |
| 17 | Flintco | 110,350,000 |
| 18 | KBE Building Corp. | 89,239,714 |
| 19 | Bernards | 85,000,000 |
| 20 | Sundt Construction | 69,522,647 |
| 21 | Absher Construction | 67,476,142 |
| 22 | LeChase Construction Services | 65,600,000 |
| 23 | Walsh Group, The | 62,965,887 |
| 24 | Wight & Company | 61,092,000 |
| 25 | Lend Lease | 59,255,000 |
| 26 | Haselden Construction | 55,166,396 |
| 27 | LPCiminelli | 54,810,831 |
| 28 | Shawmut Design and Construction | 51,000,000 |
| 29 | Ryan Companies US | 48,316,285 |
| 30 | URS Corp. | 47,642,239 |
| 31 | Yates Companies, The | 42,800,000 |
| 32 | Pepper Construction | 35,760,000 |
| 33 | C.W. Driver | 35,595,000 |
| 34 | E.W. Howell | 33,818,000 |
| 35 | Coakley & Williams Construction | 32,267,167 |
| 36 | Brasfield & Gorrie | 30,364,402 |
| 37 | Choate Construction | 30,237,395 |
| 38 | Bette Companies, The | 29,375,000 |
| 39 | S. M. Wilson & Co. | 25,725,568 |
| 40 | Suffolk Construction | 25,620,266 |
| 41 | EMJ Corp. | 24,000,000 |
| 42 | Parsons Brinckerhoff | 20,057,993 |
| 43 | Manhattan Construction | 19,124,000 |
| 44 | New South Construction | 17,650,000 |
| 45 | Hill & Wilkinson | 17,026,000 |
| 46 | Kitchell Corp. | 16,545,918 |
| 47 | Heery International | 14,994,535 |
| 48 | HITT Contracting | 14,900,000 |
| 49 | Robins & Morton | 13,176,447 |
| 50 | W. M. Jordan Company | 12,735,471 |
| 51 | Messer Construction | 12,453,591 |
| 52 | Structure Tone | 12,081,000 |
| 53 | Hill International | 12,000,000 |
| 54 | Boldt Company, The | 11,978,048 |
| 55 | Hathaway Dinwiddie Construction | 11,690,000 |
| 56 | James G. Davis Construction | 10,187,161 |
| 57 | Stalco Construction | 10,040,000 |
| 58 | STV | 8,018,000 |
| 59 | Hunt Construction Group | 7,000,000 |
| 60 | O'Neil Industries/W.E. O'Neil | 5,825,412 |
| 61 | Weis Builders | 3,389,000 |
| 62 | Beck Group, The | 3,117,539 |
| 63 | Allen & Shariff | 3,000,000 |
| 64 | Linbeck Group | 2,590,000 |
| 65 | Batson-Cook | 1,810,861 |
| 66 | Hoar Construction | 1,769,000 |
| 67 | Clark Group | 1,731,296 |
| 68 | James McHugh Construction | 1,460,905 |
| 69 | Weitz Company, The | 1,434,533 |
| 70 | IMC Construction | 1,433,690 |
| 71 | Astorino | 743,040 |
| 72 | JLL | 242,655 |
Read BD+C's full 2014 Giants 300 Report
Related Stories

| Dec 29, 2014
From Ag waste to organic brick: Corn stalks reused to make construction materials [BD+C's 2014 Great Solutions Report]
Ecovative Design applies its cradle-to-cradle process to produce 10,000 organic bricks used to build a three-tower structure in Long Island City, N.Y. The demonstration project was named a 2014 Great Solution by the editors of Building Design+Construction.

| Dec 29, 2014
14 great solutions for the commercial construction market
Ideas are cheap. Solutions are what count. The latest installment in BD+C's Great Solutions series presents 14 ways AEC professionals, entrepreneurs, and other clever folk have overcome what seemed to be insoluble problems—from how to make bricks out of agricultural waste, to a new way to keep hospitals running clean during construction.

| Dec 29, 2014
HealthSpot station merges personalized healthcare with videoconferencing [BD+C's 2014 Great Solutions Report]
The HealthSpot station is an 8x5-foot, ADA-compliant mobile kiosk that lets patients access a network of board-certified physicians through interactive videoconferencing and medical devices. It was named a 2014 Great Solution by the editors of Building Design+Construction.

| Dec 28, 2014
Robots, drones, and printed buildings: The promise of automated construction
Building Teams across the globe are employing advanced robotics to simplify what is inherently a complex, messy process—construction.

BIM and Information Technology | Dec 28, 2014
The Big Data revolution: How data-driven design is transforming project planning
There are literally hundreds of applications for deep analytics in planning and design projects, not to mention the many benefits for construction teams, building owners, and facility managers. We profile some early successful applications.
 Campus, the Building Team took advantage of the sites natural coastal g")
| Dec 28, 2014
AIA course: Enhancing interior comfort while improving overall building efficacy
Providing more comfortable conditions to building occupants has become a top priority in today’s interior designs. This course is worth 1.0 AIA LU/HSW.

| Dec 28, 2014
6 trends steering today's college residence halls
University students want more in a residence hall than just a place to sleep. They want a space that reflects their style of living and learning.
")
| Dec 28, 2014
Using energy modeling to increase project value [AIA course]
This course, worth 1.0 AIA LU/HSW, explores how to increase project value through energy modeling, as well as how to conduct quick payback and net present value studies to identify which energy strategies are most viable for the project.
| Dec 28, 2014
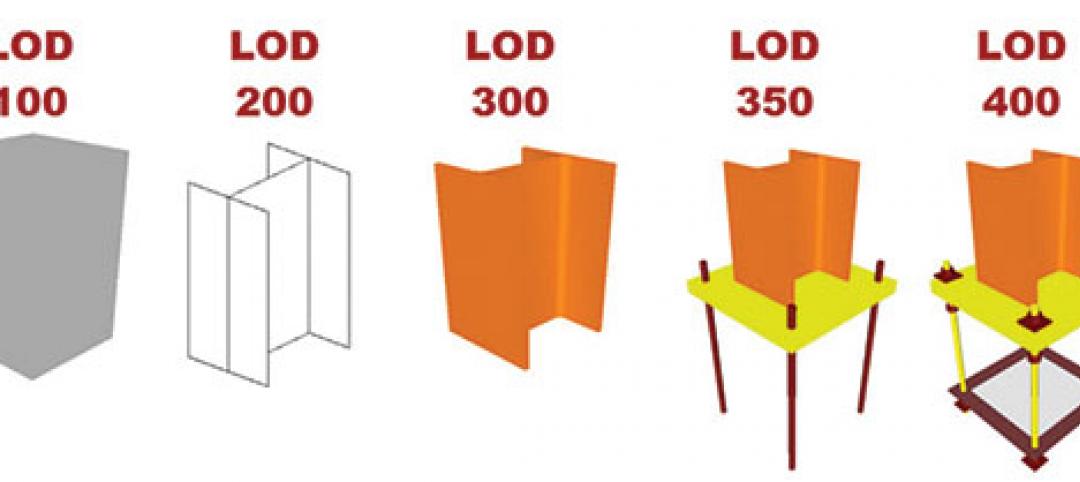
The lowdown on LODs: Bringing clarity to BIM
These days, BIM is par for the course across most facets of design. But a lot of the conversation surrounding BIM still lacks clarity due to ambiguous terminology, a lack of clear-cut guiding illustrations, and widely varying implementation, writes GS&P's John Scannell.

| Dec 28, 2014
The future of airport terminal design: destination status, five-star amenities, stress-free travel
Taking a cue from the hospitality industry, airport executives are seeking to make their facilities feel more like destinations, writes HOK's Richard Gammon.


