


After a long period of anemic performance, with growth mostly driven by renovations and additions, the K-12 sector is showing renewed interest in new construction. Consultant Paul Abramson, using data from Dun & Bradstreet, calculates that districts spent about $13.4 billion on construction projects in 2013, about $7.6 billion of which went for new schools (http://bit.ly/1kN4qkv).
Highest-spending regions included Texas-Louisiana-Oklahoma-Arkansas ($2.3 billion, or 17% of the nation’s K-12 total) and Arizona-California-Hawaii-Nevada ($1.68 billion). The lowest-spending regions included debt-plagued Illinois with neighboring states Minnesota and Wisconsin ($651 million) and Alaska-Idaho-Oregon-Washington ($558 million).
High schools are outpacing other K-12 facilities in construction spending, with the dollar value of projected 2014 starts at $4.15 billion, or 44% of the K-12 total. That’s followed by 33% for elementary schools, 23% for middle schools, and <1% for administrative and support projects.
Among the evident design trends: STEM morphing into STEAM with the addition of arts enrichment (sometimes with professional-quality performance spaces) to science, technology, engineering, and math schools; growing enthusiasm for vocational training facilities that provide an alternative to the traditional college prep path; and schools that do a better job of cementing community connections by leveraging local architectural themes.
The push for sustainable K-12 facilities also marches on; at high levels of green, the theme typically suffuses the pedagogy. Hood River (Ore.) Middle School’s Music and Science Building was recently certified net-zero energy by the International Living Future Institute, making it the first public school building to earn the tough-to-achieve designation.
Top K-12 School Sector Architecture Firms
| Rank | Company | 2013 K-12 Revenue |
| 1 | DLR Group | $41,000,000 |
| 2 | SHW Group | 40,016,000 |
| 3 | PBK | 35,880,000 |
| 4 | HMC Architects | 26,097,082 |
| 5 | Fanning/Howey Associates | 17,877,000 |
| 6 | Perkins+will | 16,668,514 |
| 7 | Heery International | 14,994,535 |
| 8 | NAC|Architecture | 14,494,206 |
| 9 | LPA | 14,191,442 |
| 10 | Perkins Eastman | 13,950,000 |
| 11 | Quattrocchi Kwok Architects | 13,230,000 |
| 12 | Moseley Architects | 12,521,613 |
| 13 | Integrus Architecture | 12,229,858 |
| 14 | Corgan | 10,372,178 |
| 15 | FGM Architects | 9,846,977 |
| 16 | NTD Architecture | 9,200,000 |
| 17 | Parkhill, Smith & Cooper | 8,580,000 |
| 18 | Symmes Maini & McKee Associates | 8,375,000 |
| 19 | Stantec | 8,097,800 |
| 20 | SchenkelShultz Architecture | 7,880,000 |
| 21 | SEI Design Group | 7,566,000 |
| 22 | Slaterpaull Architects | 7,500,468 |
| 23 | DLA Architects | 7,255,830 |
| 24 | GWWO | 7,047,216 |
| 25 | BRPH | 6,681,000 |
| 26 | Legat Architects | 6,630,200 |
| 27 | Wight & Company | 6,579,000 |
| 28 | Ashley McGraw Architects | 6,093,874 |
| 29 | HMFH Architects | 6,032,607 |
| 30 | BBS Architects | 5,950,250 |
| 31 | BLDD Architects | 5,750,000 |
| 32 | LaBella Associates | 5,644,772 |
| 33 | LS3P | 5,155,547 |
| 34 | Eppstein Uhen Architects | 4,623,477 |
| 35 | H+L Architecture | 4,070,997 |
| 36 | EwingCole | 4,020,000 |
| 37 | FXFOWLE Architects | 3,940,000 |
| 38 | Harley Ellis Devereaux | 3,780,000 |
| 39 | Cooper Carry | 3,402,330 |
| 40 | Goodwyn Mills & Cawood | 3,399,167 |
| 41 | CTA Architects Engineers | 3,336,600 |
| 42 | HKS | 3,142,143 |
| 43 | Cuningham Group Architecture | 3,052,272 |
| 44 | Schrader Group Architecture | 3,047,414 |
| 45 | NORR | 2,976,836 |
| 46 | Hord Coplan Macht | 2,948,595 |
| 47 | Ratio Architects | 2,879,009 |
| 48 | Albert Kahn Associates | 2,775,253 |
| 49 | IBI Group ? Gruzen Samton | 2,500,000 |
| 50 | RS&H | 2,450,000 |
| 51 | Harvard Jolly Architecture | 2,097,387 |
| 52 | Shepley Bulfinch | 2,000,000 |
| 53 | Becker Morgan Group | 1,945,649 |
| 54 | Leo A Daly | 1,787,681 |
| 55 | Good Fulton & Farrell | 1,704,900 |
| 56 | KZF Design | 1,490,333 |
| 57 | Clark Nexsen | 1,441,748 |
| 58 | Little | 1,410,229 |
| 59 | LMN Architects | 1,223,400 |
| 60 | Smallwood, Reynolds, Stewart, Stewart & Associates | 1,213,567 |
| 61 | Environetics | 1,137,965 |
| 62 | Massa Montalto Architects | 1,056,000 |
| 63 | VOA Associates | 989,711 |
| 64 | Mithun | 930,000 |
| 65 | Gensler | 700,000 |
| 66 | WHR Architects | 699,316 |
| 67 | PGAL | 672,000 |
| 68 | Ennead Architects | 585,055 |
| 69 | Davis Brody Bond | 570,932 |
| 70 | DesignGroup | 538,710 |
| 71 | OZ Architecture | 487,900 |
| 72 | Kirksey | 466,989 |
| 73 | HNTB Corp. | 444,786 |
| 74 | Beyer Blinder Belle | 405,394 |
| 75 | CO Architects | 386,900 |
| 76 | RSP Architects | 377,000 |
| 77 | LawKingdon Architecture | 350,000 |
| 78 | Ziegler Cooper | 348,762 |
| 79 | Morris Architects | 335,000 |
| 80 | Rule Joy Trammell + Rubio | 320,000 |
| 81 | Cambridge Seven Associates | 305,000 |
| 82 | Ware Malcomb | 284,000 |
| 83 | Hoffmann Architects | 260,000 |
| 84 | CASCO Diversified Corp. | 250,000 |
| 85 | JRS Architect | 235,000 |
| 86 | Rosser International | 230,000 |
| 87 | Page | 229,000 |
| 88 | Nelson | 210,577 |
| 89 | Gresham, Smith and Partners | 200,000 |
| 90 | Hastings+Chivetta Architects | 169,568 |
| 91 | Nadel | 130,000 |
| 92 | Epstein | 108,000 |
| 93 | BSA LifeStructures | 106,426 |
| 94 | ATA Beilharz Architects | 104,525 |
| 95 | Niles Bolton Associates | 104,386 |
| 96 | Hensley Lamkin Rachel | 100,000 |
| 97 | GBBN Architects | 97,000 |
| 98 | Sherlock, Smith & Adams | 92,000 |
| 99 | Lord Aeck Sargent | 75,379 |
| 100 | Poskanzer Skott | 50,000 |
| 101 | TEG Architects | 11,928 |
Top K-12 School Sector Engineering Firms
| Rank | Company | 2013 K-12 Revenue |
| 1 | AECOM Technology Corp. | $50,930,000 |
| 2 | URS Corp. | 47,642,239 |
| 3 | Jacobs | 35,150,000 |
| 4 | Parsons Brinckerhoff | 20,057,993 |
| 5 | TTG | 12,352,642 |
| 6 | STV | 8,018,000 |
| 7 | Shive-Hattery | 5,975,671 |
| 8 | KCI Technologies | 4,800,000 |
| 9 | Dewberry | 4,340,398 |
| 10 | Joseph R. Loring & Associates | 4,300,000 |
| 11 | Heapy Engineering | 4,079,921 |
| 12 | Thornton Tomasetti | 3,617,144 |
| 13 | Wiss, Janney, Elstner Associates | 3,380,000 |
| 14 | Allen & Shariff | 3,000,000 |
| 15 | Interface Engineering | 2,934,922 |
| 16 | KJWW Engineering Consultants | 2,878,919 |
| 17 | Paulus, Sokolowski and Sartor | 2,800,000 |
| 18 | Brinjac Engineering | 2,677,720 |
| 19 | Simpson Gumpertz & Heger | 2,610,000 |
| 20 | M/E Engineering | 2,531,610 |
| 21 | Primera Engineers | 2,357,000 |
| 22 | French & Parrello Associates | 2,297,300 |
| 23 | Coffman Engineers | 2,147,260 |
| 24 | Henderson Engineers | 2,103,903 |
| 25 | Bridgers & Paxton Consulting Engineers | 2,024,344 |
| 26 | RDK Engineers | 1,880,000 |
| 27 | Wallace Engineering | 1,691,000 |
| 28 | KPFF Consulting Engineers | 1,625,000 |
| 29 | H.F. Lenz | 1,619,250 |
| 30 | Highland Associates | 1,600,000 |
| 31 | KLH Engineers | 1,384,045 |
| 32 | Glumac | 1,306,149 |
| 33 | AKF Group | 1,299,000 |
| 34 | Rist-Frost-Shumway Engineering | 1,000,000 |
| 35 | Fishbeck, Thompson, Carr & Huber | 1,000,000 |
| 36 | CJL Engineering | 994,410 |
| 37 | TLC Engineering for Architecture | 967,161 |
| 38 | M-E Engineers | 966,000 |
| 39 | Walter P Moore and Associates | 937,062 |
| 40 | Vanderweil Engineers | 808,300 |
| 41 | Karpinski Engineering | 720,037 |
| 42 | Sparling | 682,833 |
| 43 | Martin/Martin | 674,166 |
| 44 | SSOE Group | 664,516 |
| 45 | RMF Engineering | 650,000 |
| 46 | Aon Fire Protection Engineering Corp. | 540,000 |
| 47 | Newcomb & Boyd | 534,136 |
| 48 | Environmental Systems Design | 521,731 |
| 49 | Guernsey | 502,819 |
| 50 | I. C. Thomasson Associates | 500,000 |
| 51 | G&W Engineering Corp. | 484,000 |
| 52 | Wick Fisher White | 446,553 |
| 53 | Arup | 431,084 |
| 54 | CTLGroup | 400,000 |
| 55 | OLA Consulting Engineers | 308,400 |
| 56 | Kamm Consulting | 286,426 |
| 57 | DeSimone Consulting Engineers | 262,015 |
| 58 | GRW | 189,200 |
| 59 | Zak Companies | 178,364 |
| 60 | Dunham Associates | 150,000 |
| 61 | Mazzetti | 149,031 |
| 62 | Davis, Bowen & Friedel | 132,028 |
| 63 | Affiliated Engineers | 112,000 |
| 64 | Spectrum Engineers | 93,110 |
| 65 | Magnusson Klemencic Associates | 76,069 |
Top K-12 School Sector Construction Firms
| Rank | Company | 2013 K-12 Revenue |
| 1 | Gilbane | $480,230,252 |
| 2 | Turner Construction | 419,619,000 |
| 3 | Balfour Beatty US | 372,288,885 |
| 4 | CORE Construction Group | 278,177,865 |
| 5 | Skanska USA | 212,802,648 |
| 6 | Swinerton Builders | 182,000,000 |
| 7 | Kraus-Anderson Construction | 181,000,000 |
| 8 | JE Dunn Construction | 167,798,654 |
| 9 | Consigli Construction | 151,997,147 |
| 10 | Whiting-Turner Contracting Co., The | 146,933,150 |
| 11 | Adolfson & Peterson Construction | 142,957,713 |
| 12 | Barton Malow | 142,524,833 |
| 13 | McCarthy Holdings | 140,400,000 |
| 14 | PCL Construction | 122,996,983 |
| 15 | Tutor Perini Corp. | 120,049,254 |
| 16 | McShane Companies, The | 118,124,887 |
| 17 | Flintco | 110,350,000 |
| 18 | KBE Building Corp. | 89,239,714 |
| 19 | Bernards | 85,000,000 |
| 20 | Sundt Construction | 69,522,647 |
| 21 | Absher Construction | 67,476,142 |
| 22 | LeChase Construction Services | 65,600,000 |
| 23 | Walsh Group, The | 62,965,887 |
| 24 | Wight & Company | 61,092,000 |
| 25 | Lend Lease | 59,255,000 |
| 26 | Haselden Construction | 55,166,396 |
| 27 | LPCiminelli | 54,810,831 |
| 28 | Shawmut Design and Construction | 51,000,000 |
| 29 | Ryan Companies US | 48,316,285 |
| 30 | URS Corp. | 47,642,239 |
| 31 | Yates Companies, The | 42,800,000 |
| 32 | Pepper Construction | 35,760,000 |
| 33 | C.W. Driver | 35,595,000 |
| 34 | E.W. Howell | 33,818,000 |
| 35 | Coakley & Williams Construction | 32,267,167 |
| 36 | Brasfield & Gorrie | 30,364,402 |
| 37 | Choate Construction | 30,237,395 |
| 38 | Bette Companies, The | 29,375,000 |
| 39 | S. M. Wilson & Co. | 25,725,568 |
| 40 | Suffolk Construction | 25,620,266 |
| 41 | EMJ Corp. | 24,000,000 |
| 42 | Parsons Brinckerhoff | 20,057,993 |
| 43 | Manhattan Construction | 19,124,000 |
| 44 | New South Construction | 17,650,000 |
| 45 | Hill & Wilkinson | 17,026,000 |
| 46 | Kitchell Corp. | 16,545,918 |
| 47 | Heery International | 14,994,535 |
| 48 | HITT Contracting | 14,900,000 |
| 49 | Robins & Morton | 13,176,447 |
| 50 | W. M. Jordan Company | 12,735,471 |
| 51 | Messer Construction | 12,453,591 |
| 52 | Structure Tone | 12,081,000 |
| 53 | Hill International | 12,000,000 |
| 54 | Boldt Company, The | 11,978,048 |
| 55 | Hathaway Dinwiddie Construction | 11,690,000 |
| 56 | James G. Davis Construction | 10,187,161 |
| 57 | Stalco Construction | 10,040,000 |
| 58 | STV | 8,018,000 |
| 59 | Hunt Construction Group | 7,000,000 |
| 60 | O'Neil Industries/W.E. O'Neil | 5,825,412 |
| 61 | Weis Builders | 3,389,000 |
| 62 | Beck Group, The | 3,117,539 |
| 63 | Allen & Shariff | 3,000,000 |
| 64 | Linbeck Group | 2,590,000 |
| 65 | Batson-Cook | 1,810,861 |
| 66 | Hoar Construction | 1,769,000 |
| 67 | Clark Group | 1,731,296 |
| 68 | James McHugh Construction | 1,460,905 |
| 69 | Weitz Company, The | 1,434,533 |
| 70 | IMC Construction | 1,433,690 |
| 71 | Astorino | 743,040 |
| 72 | JLL | 242,655 |
Read BD+C's full 2014 Giants 300 Report
Related Stories

Sponsored | BD+C University Course | Feb 17, 2022
Metal roofing trends
New ideas in design and constructability are radically changing how metal systems are used as roofing for commercial and institutional buildings. Behind the investment in these new kinds of expressions and construction approaches is a growing interest in improved performance and reduced environmental impact. Metal roofing systems can cut cooling and heating loads significantly, according to the EPA.

Data Centers | Feb 15, 2022
Data center boom: How two AEC firms plan to meet unprecedented demand for data center facilities
Ramboll's Jim Fox and EYP Mission Critical Facilities' Rick Einhorn discuss the recent joining of their companies at a time of unprecedented data center demand. BD+C's John Caulfield leads the discussion with Fox, Ramboll's Managing Director for the Americas, and Einhorn, EYP Mission Critical Facilities' Managing Director.
 is pleased to announce the acquisition of architecture and interior design firm Binkley Garcia Architecture in Nashville.")
Architects | Feb 15, 2022
Binkley Garcia Architecture and Goodwyn Mills Cawood join forces in Nashville
Goodwyn Mills Cawood (GMC) is pleased to announce the acquisition of architecture and interior design firm Binkley Garcia Architecture in Nashville.

Resiliency | Feb 15, 2022
Design strategies for resilient buildings
LEO A DALY's National Director of Engineering Kim Cowman takes a building-level look at resilient design.

Products and Materials | Feb 14, 2022
How building owners and developers can get ahead of the next supply chain disaster
Global supply chain interruptions that started at the very beginning of the pandemic are still with us and compounding every step of the way. Below are a few proven tips on how to avert some of the costly fallout should we be faced with similar commercial disasters at any time in the future.

Urban Planning | Feb 14, 2022
5 steps to remake suburbs into green communities where people want to live, work, and play
Stantec's John Bachmann offers proven tactic for retrofitting communities for success in the post-COVID era.

Urban Planning | Feb 11, 2022
6 ways to breathe life into mixed-use spaces
To activate mixed-use spaces and realize their fullest potential, project teams should aim to create a sense of community and pay homage to the local history.

Senior Living Design | Feb 11, 2022
Design for senior living: A chat with Rocky Berg, AIA
Rob Cassidy, Editor of MULTIFAMILY Design + Construction, chats with Rocky Berg, AIA, Principal with Dallas architecture firm three, about how to design senior living communities to meet the needs of the owner, seniors, their families, and staff.
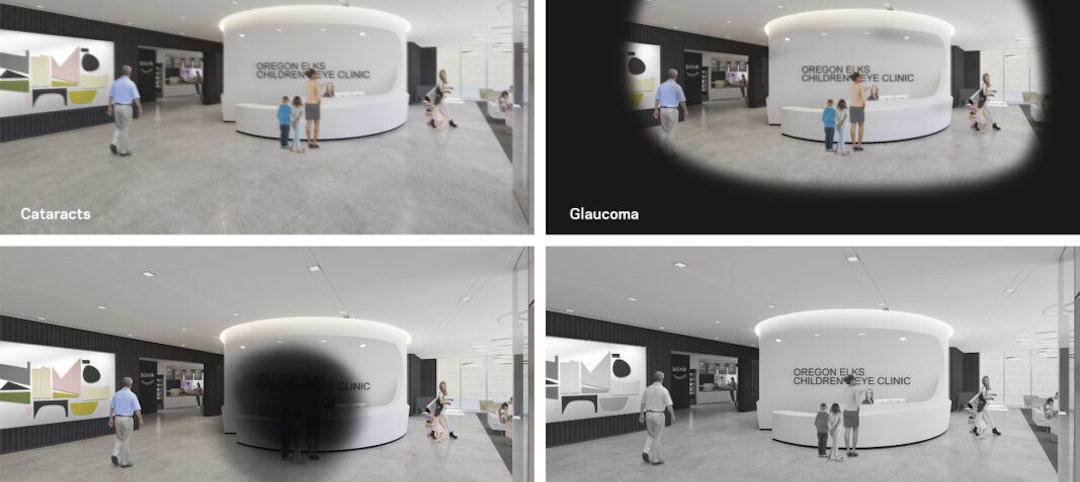
Architects | Feb 11, 2022
How computer simulations of vision loss create more empathetic buildings for the visually impaired
Here is a look at four challenges identified from our research and how the design responds accordingly.

Healthcare Facilities | Feb 10, 2022
Respite for the weary healthcare worker
The pandemic has shined a light on the severe occupational stress facing healthcare workers. Creating restorative hospital environments can ease their feelings of anxiety and burnout while improving their ability to care for patients.


