


A strong retail sector has helped drive 2016 U.S. construction activity with retail construction projects up 24.4% year-over-year. Overshadowing the good news is a cloud of economic uncertainty that has companies laser-focused on lean budgeting and smart spending decisions.
According to JLL’s latest report on non-residential construction activity, U.S. construction employment grew 4.7% in the first quarter of 2016 over the first quarter of 2015, with many workers engaged on retail projects. Concerns about China’s steep economic deceleration, combined with a drop in U.S. gross domestic product (GDP) from 1.4% in the fourth quarter of 2015 to 0.5% in the first quarter of 2016, have made companies reluctant to invest.
The market for commercial construction remains active for now. The JLL report shows a strong first quarter with steady growth projected for second quarter. The office, industrial and retail sectors are very active as companies continue projects that broke ground a year or two ago. A hint of the economic clouds causing concern comes from a small decline in office construction starts.
“Developers and occupiers are proceeding with caution, but they continue to build and renovate,” explains Todd Burns, President, Project and Development Services, JLL Americas. “However, project sponsors today are thinking more strategically about development versus renovation. The best-managed companies have learned to keep their capital spend within about two% of the plan by starting with a realistic budget, leveraging data and analytical platforms, and putting the right skills together in a centralized project team.”
Key sectors to watch
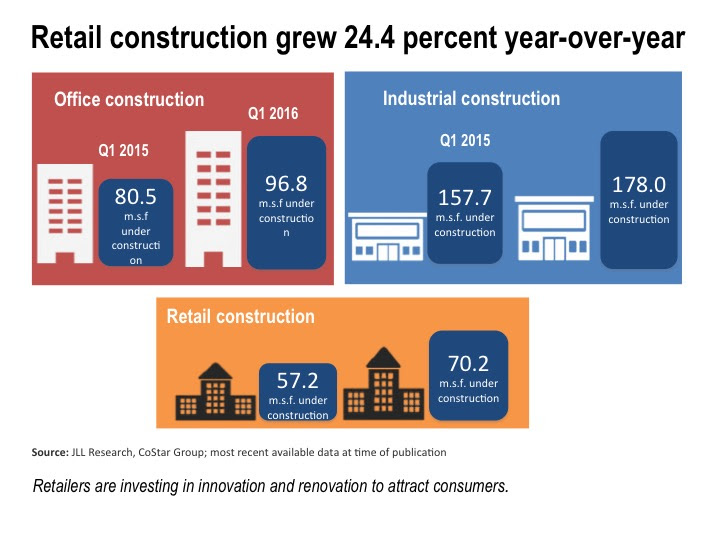
Retail: Retail vacancies continue to decline, and retail has surged ahead of other property types in construction activity. Construction grew 24.4% year over year, from 57.2 million sf in first.
Industrial: Industrial facility deliveries grew year-over-year in Q1 2016, reflecting the continuing strength in demand for modern industrial properties—much of it from retailers and e-commerce companies striving to meet changing consumer demand and service requirements. Construction grew 12.9%, from 157.7 million sf in Q1 2015 to 178 million sf in Q1 2016.
Office: Office building construction grew by 20.2 year-over-year, from 80.5 million sf to 96.8 million sf—but starts declined by 33%, from 20.3 million to 13.6 million, reflecting economic concerns and hesitancy to launch new projects.
Retail innovation and renovation
Much of the retail construction growth in Q1 2016 has come from renovation, rather than new deliveries, as retailers are evolving to meet consumers’ ever-growing expectations for unified online and brick-and-mortar experiences.
“Retailers must innovate quickly to capture the untapped needs and expectations of consumers, who expect the same brand experience whether shopping online or in the brick-and-mortar store,” said Aaron Spiess, co-founder of Big Red Rooster, JLL’s brand experience company. “If retailers wait too long to translate latent customer expectations into new stores or renovation programs, they may find that customers have become entrenched with competing brands and are not going to return.”
Another incentive to renovate, notes Spiess, is a new federal tax break providing “safe harbor” for some remodeling expenses. Eligible retailers and restaurants can reduce 75% of qualifying expenses with the remaining 25% capitalized and depreciated over time.
Key markets to watch
Nashville: The Southeast saw an uptick in office, industrial and retail construction in the last year. Nashville, in particular, has seen rapid construction growth and low vacancy rates as employers take advantage of the city’s low-cost, well-educated workforce.
San Francisco: The Bay area is catching up to New York in of construction costs, driven by high demand and high labor costs. San Francisco is on pace to exceed New York as the U.S.’ most expensive construction market in 2016.
Dallas: As retailers followed population flows to Texas, Dallas has become one of the few markets that experienced retail development growth. Dallas was the most active retail market in Q1, up nearly 80% year over year.
Related Stories

Market Data | May 13, 2021
Proliferating materials price increases and supply chain disruptions squeeze contractors and threaten to undermine economic recovery
Producer price index data for April shows wide variety of materials with double-digit price increases.

Market Data | May 7, 2021
Construction employment stalls in April
Soaring costs, supply-chain challenges, and workforce shortages undermine industry's recovery.

Market Data | May 4, 2021
Nonresidential construction outlays drop in March for fourth-straight month
Weak demand, supply-chain woes make further declines likely.

Market Data | May 3, 2021
Nonresidential construction spending decreases 1.1% in March
Spending was down on a monthly basis in 11 of the 16 nonresidential subcategories.

Market Data | Apr 30, 2021
New York City market continues to lead the U.S. Construction Pipeline
New York City has the greatest number of projects under construction with 110 projects/19,457 rooms.

Market Data | Apr 29, 2021
U.S. Hotel Construction pipeline beings 2021 with 4,967 projects/622,218 rooms at Q1 close
Although hotel development may still be tepid in Q1, continued government support and the extension of programs has aided many businesses to get back on their feet as more and more are working to re-staff and re-open.

Market Data | Apr 28, 2021
Construction employment declines in 203 metro areas from March 2020 to March 2021
The decline occurs despite homebuilding boom and improving economy.

Market Data | Apr 20, 2021
The pandemic moves subs and vendors closer to technology
Consigli’s latest market outlook identifies building products that are high risk for future price increases.

Market Data | Apr 20, 2021
Demand for design services continues to rapidly escalate
AIA’s ABI score for March rose to 55.6 compared to 53.3 in February.

Market Data | Apr 16, 2021
Construction employment in March trails March 2020 mark in 35 states
Nonresidential projects lag despite hot homebuilding market.


