

Top International Architecture Firms
| Rank | Company | 2012 International Revenue ($) |
| 1 | Gensler | $202,138,052 |
| 2 | Skidmore, Owings & Merrill | $155,083,000 |
| 3 | HOK | $147,000,000 |
| 4 | Kohn Pedersen Fox Associates | $122,280,500 |
| 5 | RTKL Associates | $105,228,000 |
| 6 | Perkins+Will | $79,950,291 |
| 7 | Cannon Design | $70,000,000 |
| 8 | HDR Architecture | $69,100,000 |
| 9 | Callison | $63,491,116 |
| 10 | WATG / Wimberly Interiors | $58,638,000 |
| 11 | PageSoutherlandPage | $43,330,000 |
| 12 | Stantec | $43,300,000 |
| 13 | NBBJ | $37,445,000 |
| 14 | Perkins Eastman | $36,250,000 |
| 15 | HKS | $33,000,000 |
| 16 | IBI Group | $32,888,520 |
| 17 | Populous | $30,990,000 |
| 18 | Jerde Partnership, The | $17,800,000 |
| 19 | Swanke Hayden Connell Asrchitects | $14,500,000 |
| 20 | Cambridge Seven Associates | $13,424,000 |
| 21 | Goettsch Partners | $12,340,000 |
| 22 | Kaplan McLaughlin Diaz | $11,402,329 |
| 23 | Leo A Daly | $11,225,000 |
| 24 | Smallwood, Reynolds, Stewart, Stewart & Associates | $9,981,006 |
| 25 | VOA Associates | $9,430,080 |
| 26 | GBBN Architects | $7,860,000 |
| 27 | ZGF Architects | $7,624,814 |
| 28 | BBG-BBGM | $6,800,000 |
| 29 | Epstein | $6,754,000 |
| 30 | FXFOWLE Architects | $5,735,071 |
| 31 | MBH Architects | $5,700,000 |
| 32 | SmithGroupJJR | $5,300,000 |
| 33 | HLW International | $5,000,000 |
| 33 | Albert Kahn Family of Companies | $5,000,000 |
| 35 | Payette | $4,905,720 |
| 36 | Cuningham Group Architecture | $4,850,000 |
| 37 | FRCH Design Worldwide | $3,900,000 |
| 38 | Sasaki Associates | $3,486,090 |
| 39 | Perkowitz+Ruth Architects | $3,400,000 |
| 40 | WHR Architects | $2,969,358 |
| 41 | RNL | $2,500,000 |
| 42 | Corgan | $2,490,000 |
| 43 | Hoefer Wysocki Architecture | $2,479,000 |
| 44 | Beyer Blinder Belle Architects & Planners | $2,297,652 |
| 45 | EwingCole | $2,000,000 |
| 46 | Gresham, Smith and Partners | $1,935,498 |
| 47 | LMN Architects | $1,798,700 |
| 48 | KZF Design | $1,610,959 |
| 49 | Ware Malcomb | $1,600,000 |
| 50 | Fentress Architects | $1,502,800 |
| 51 | OZ Architecture | $1,500,000 |
| 52 | DLR Group | $1,300,000 |
| 53 | Integrated Design Group | $1,159,416 |
| 54 | Nadel | $1,000,000 |
| 55 | Sherlock, Smith & Adams | $916,000 |
| 56 | HMC Architects | $900,000 |
| 57 | Reynolds, Smith and Hills | $872,000 |
| 58 | Davis Brody Bond | $700,000 |
| 59 | FKP Architects | $680,000 |
| 60 | Flad Architects | $631,128 |
| 61 | Solomon Cordwell Buenz | $571,000 |
| 62 | CTA Architects Engineers | $500,000 |
| 63 | Astorino | $484,000 |
| 64 | Little | $473,000 |
| 65 | Ennead Architects | $410,000 |
| 66 | Heery International | $394,000 |
| 67 | NTD Architecture | $391,557 |
| 68 | NELSON | $346,071 |
| 69 | Westlake Reed Leskosky | $300,000 |
| 70 | Morris Architects | $250,000 |
| 71 | Harvard Jolly Architecture | $213,000 |
| 72 | Shepley Bulfinch Richardson & Abbott | $173,757 |
| 73 | BSA LifeStructures | $173,549 |
| 74 | api(+) | $150,000 |
| 75 | Hammel, Green and Abrahamson | $122,000 |
| 76 | FreemanWhite | $88,000 |
| 77 | Carrier Johnson + Culture | $85,362 |
| 78 | SRG Partnership | $76,351 |
| 79 | SHW Group | $42,546 |
| 80 | Cooper Carry | $26,153 |
Top International Engineering Firms
| Rank | Company | 2012 International Revenue ($) |
| 1 | Jacobs Engineering Group | $2,579,310,985 |
| 2 | Fluor | $2,534,708,300 |
| 3 | URS Corp. | $1,477,167,422 |
| 4 | Parsons Brinckerhoff | $1,214,500,000 |
| 5 | Buro Happold Consulting Engineers | $166,020,000 |
| 6 | Burns & McDonnell | $42,100,000 |
| 7 | Arup | $36,313,704 |
| 8 | SSOE Group | $31,069,888 |
| 9 | Thornton Tomasetti | $29,592,609 |
| 10 | H&A Architects & Engineers | $21,367,698 |
| 11 | Allen & Shariff | $16,100,000 |
| 12 | Middough | $9,000,000 |
| 13 | Magnusson Klemencic Associates | $8,128,991 |
| 14 | Rolf Jensen & Associates | $8,000,000 |
| 15 | M-E Engineers | $7,000,000 |
| 16 | Syska Hennessy Group | $5,733,138 |
| 17 | Merrick & Co. | $5,100,000 |
| 18 | Henderson Engineers | $4,980,000 |
| 19 | Clark Nexsen | $4,697,276 |
| 20 | Environmental Systems Design | $4,080,319 |
| 21 | Vanderweil Engineers | $3,567,700 |
| 22 | Ross & Baruzzini | $3,241,379 |
| 23 | Aon Fire Protection Engineering | $3,000,000 |
| 24 | Science Applications International Corp. | $2,708,771 |
| 25 | Walter P Moore | $2,593,808 |
| 26 | Glumac | $2,500,000 |
| 27 | Walker Parking Consultants | $2,377,824 |
| 28 | Simpson Gumpertz & Heger | $2,100,000 |
| 29 | KPFF Consulting Engineers | $2,000,000 |
| 30 | Affiliated Engineers | $1,985,000 |
| 31 | Peter Basso Associates | $1,800,000 |
| 32 | TLC Engineering for Architecture | $1,628,063 |
| 33 | RMF Engineering Design | $1,500,000 |
| 34 | Interface Engineering | $1,232,906 |
| 35 | BRPH | $1,190,000 |
| 36 | CTLGroup | $900,000 |
| 37 | KJWW Engineering Consultants | $725,000 |
| 38 | Bard, Rao + Athanas Consulting Engineers | $650,000 |
| 39 | CCRD Partners | $500,000 |
| 39 | Hixson Architecture, Engineering, Interiors | $500,000 |
| 41 | AKF Group | $439,000 |
| 42 | Newcomb & Boyd | $217,079 |
| 43 | ThermalTech Engineering | $175,000 |
| 44 | Mazzetti | $126,899 |
| 45 | Wiss, Janney, Elstner Associates | $125,000 |
| 46 | Primera Engineers | $112,000 |
| 47 | Coffman Engineers | $100,000 |
| 47 | Paulus, Sokolowski and Sartor | $100,000 |
| 49 | Degenkolb Engineers | $89,391 |
| 50 | Spectrum Engineers | $83,266 |
| 51 | Sparling | $69,985 |
| 52 | TTG | $50,000 |
| 53 | Zak Companies | $40,061 |
Top International Construction Firms
| Rank | Company | 2012 International Revenue ($) |
| 1 | B. L. Harbert International | $448,930,896 |
| 2 | ECC | $363,543,212 |
| 3 | Jones Lang LaSalle | $205,493,000 |
| 4 | Gilbane | $182,628,000 |
| 5 | Structure Tone | $167,444,000 |
| 6 | Walsh Group, The | $147,508,376 |
| 7 | Yates Cos., The | $73,700,000 |
| 8 | PCL Construction Enterprises | $58,194,468 |
| 9 | Turner Corporation, The | $55,470,000 |
| 10 | Walbridge | $31,000,000 |
| 11 | Alberici Constructors | $27,837,042 |
| 12 | DPR Construction | $23,642,679 |
| 13 | Haskell | $18,176,169 |
| 14 | Lend Lease | $16,844,000 |
| 15 | Weitz Co., The | $5,221,000 |
| 16 | Mortenson Construction | $860,000 |
| 17 | Hunt Companies | $511,927 |
Read the full 2013 Giants 300 Report
Related Stories
Architects | Feb 27, 2018
But first, let me take a selfie: Designing sharable moments
The concept of “selfie walls” has been around for years, but with their growing popularity they have begun to evolve and take on a life of their own.

Market Data | Feb 27, 2018
AIA small firm report: Half of employees have ownership stake in their firm
The American Institute of Architects has released its first-ever Small Firm Compensation Report.

Museums | Feb 26, 2018
*UPDATED* Design team unveils plans for the renovated and expanded Gateway Arch Museum
The goal of the project is to create closer and more robust connections between the Gateway Arch Museum and the landscape of the Jefferson National Expansion Memorial.

Architects | Feb 23, 2018
AIA elevates 152 members and two international architects to the College of Fellows
AIA Fellowship recognizes significant contributions to profession of architecture and society.
Airports | Feb 21, 2018
Terminal Modernization: Why Bother? Part II
This is the second post in our series examining why airport operators should bother to upgrade their facilities, even if capacity isn’t forcing the issue.
Urban Planning | Feb 21, 2018
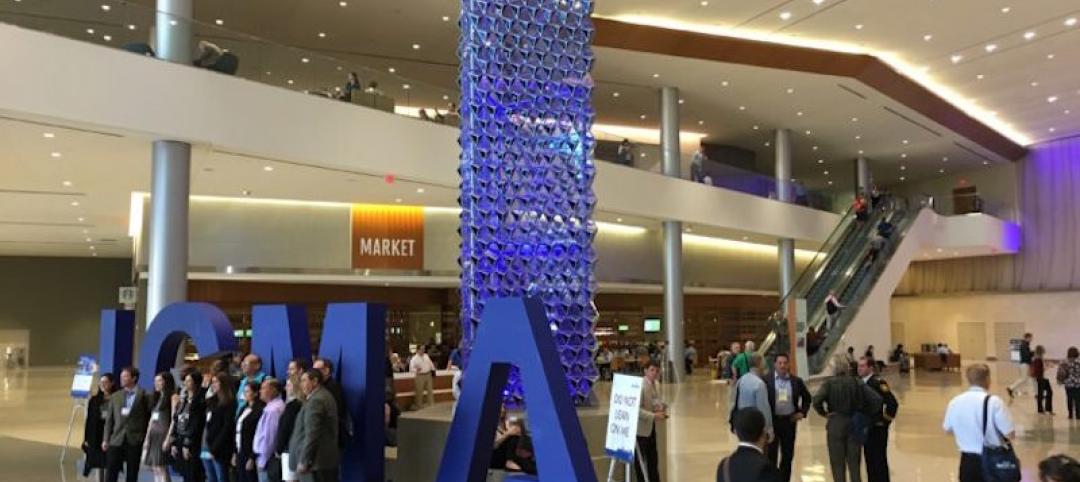
Leading communities in the Second Machine Age
What exactly is the Second Machine Age? The name refers to a book by MIT researchers Erik Brynjolfsson and Andrew McAfee.
Retail Centers | Feb 20, 2018
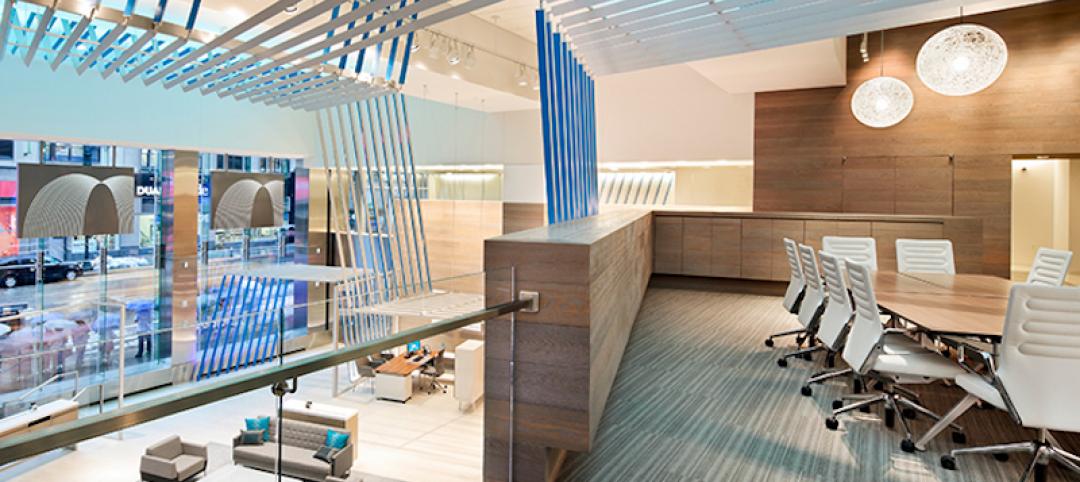
Is there a future in retail banking? Part II
It is critical to not view the physical branch as just another sales channel, but as an important touchpoint along a customer’s journey.
Architects | Feb 15, 2018
AIASF Equity by Design to launch 2018 Equity in Architecture Survey
AIA San Francisco (AIASF) and the Equity by Design Committee, launched the third national Equity in Architecture Survey on February 12, 2018. Building upon the survey conducted in 2016, the third survey will further advance the national movement for equitable practice in the profession.
Urban Planning | Feb 14, 2018
6 urban design trends to watch in 2018
2017 saw the continuation of the evolution of expectations on the part of consumers, developers, office workers, and cities.

Office Buildings | Feb 13, 2018
Office market vacancy rate at 10-year low
Cautious development and healthy absorption across major markets contributed to the decline in vacancy, according to a new Transwestern report.


