Research by Geotab shows that the urban heat island effect can vary dramatically within the same city.
The fleet management analytics firm has released temperature gradient maps of the largest U.S. cities that take the temperature of different areas of each city. Los Angeles, at 37°F, had the most variability from the hottest to the coolest location. Seattle had the lowest variation at 6°F.
The interactive maps were created by taking hyper-local temperature readings at more than 50,000 points across America’s 20 biggest cities on the same day and time (June 21st, 2017). City centers often feel far warmer in certain areas, due to factors including paved surfaces absorbing sunshine, buildings blocking airflow, and fewer trees.
The maps could be a reference for determining which areas of a city would most benefit from cool roofs, more trees, and other environmental cooling strategies.
Related Stories
Codes and Standards | Sep 13, 2019
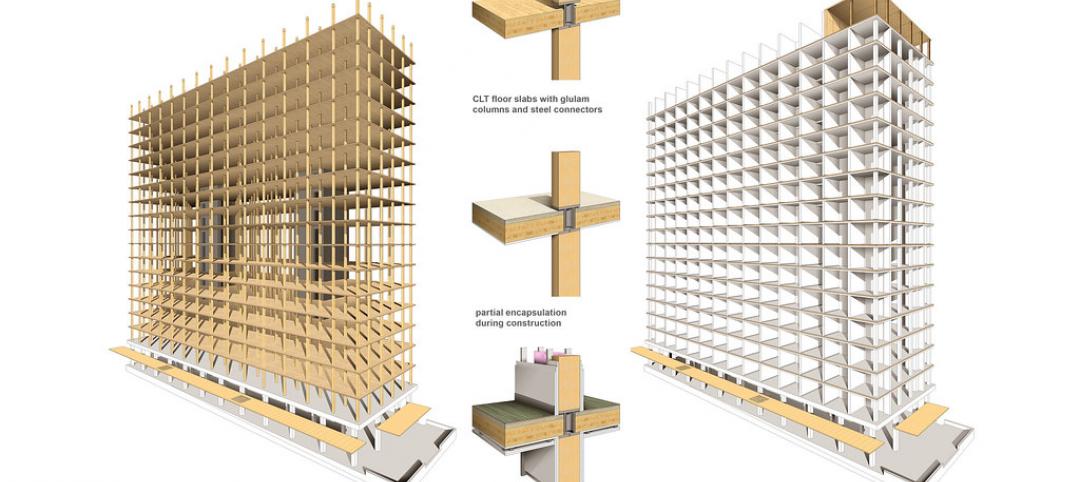
Researchers use U. of Arkansas buildings as testbed for CLT panels
Investigation could influence future use of the materials.
Codes and Standards | Sep 13, 2019
At least 30 U.S. cities have adopted stricter building energy codes since 2017
Some followed their states in implementing more robust standards.
Codes and Standards | Sep 12, 2019
Illinois law sets maximum retainage on private projects
The change is expected to give contractors bigger checks earlier in project timeline.
Codes and Standards | Sep 10, 2019
Retreat may be the best option for some coastal communities in face of sea level rise
A new study makes the case for relocating in a "strategic, managed" manner.
Codes and Standards | Sep 9, 2019
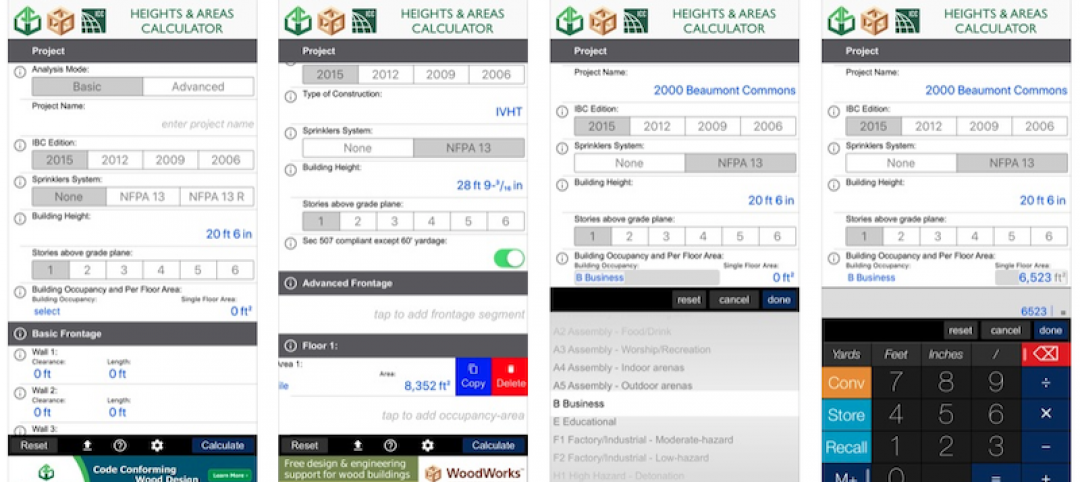
Free app calculates maximum allowable heights and areas for buildings
A free app that calculates the maximum allowable heights and areas for buildings of various occupancy classifications and types of construction has been released.
Codes and Standards | Sep 6, 2019
Standard for assessing frame deflection using one component polyurethane foams updated
The standard offers guidance when installing fenestration products.
Codes and Standards | Aug 29, 2019
The high cost of gridlock: $166 billion per year
Growing economy means more jobs, more cars, more hours stuck in traffic.
Codes and Standards | Aug 29, 2019
Industry leaders ask for government help as trades shortage worsens
AGC asks for more funding for education and increased immigration to fill gaps.
Codes and Standards | Aug 29, 2019
Code-conforming wood design guide available
The guide summarizes provisions for the use of wood and wood products in the 2018 IBC.
Codes and Standards | Aug 29, 2019
LEED residential market up 19% since 2017
The U.S. Green Building Council says that the LEED residential market has grown 19% since 2017. Nearly 500,000 single family, multifamily, and affordable housing units have been certified globally.


