


In the 12 months ended December 2021, bid construction costs rose 7.42 percent. “These increases are reminiscent of the sort of cost increases that we saw in the period 2004 to 2007,” wrote Julian Anderson, FRICS, President-North America for the construction advisory firm Rider Levett Bucknall (RLB), which today released its Fourth Quarter 2021 North America Construction Cost Report.
RLB’s National Construction Cost Index for the fourth quarter stood at 225.38, 7.4 percent higher than the Index for the fourth quarter of 2020, and 1.8 percent higher than last year’s third quarter. In his essay for this report, Anderson was optimistic about the eventual positive impact of the recently passed Bipartisan Infrastructure bill on construction and repair.

However, the force of that legislation could be stymied, or at least delayed, by supply chain problems that continue to plague the industry. Bottlenecks at western ports and chronic shortages of skilled labor still contribute to this volatility. Cost increases are also a function of rising inflation, as the Consumer Price Index registered a year-over-year increase of 5.38 percent.
On the positive side, America’s Gross Domestic Product, which measures output, returned to 2.1 percent, which was about where it was in the pre-pandemic fourth quarter of 2019. And the rate of unemployment for the construction sector dipped to 4.5 percent in Q421, versus 9.6 percent in Q420. Construction tracked national unemployment that has also been on a downward trend.
SEVERAL METROS BUCKED QUARTERLY COST TREND
Nonresidential construction spending in November 2021, the latest month for which data were available from the Census Bureau, stood at $820.6 billion, 3.4 percent higher than the same month in 2021. But materials and labor keep getting more expensive, too. RLB’s Comparative Cost Index found that, from October 2020 through October 2021, construction costs rose by 10.09 percent in Seattle, by 9.11 percent in Washington DC, by 9.01 percent in Chicago, by 8.85 percent in Boston, and by 8.51 percent in New York.

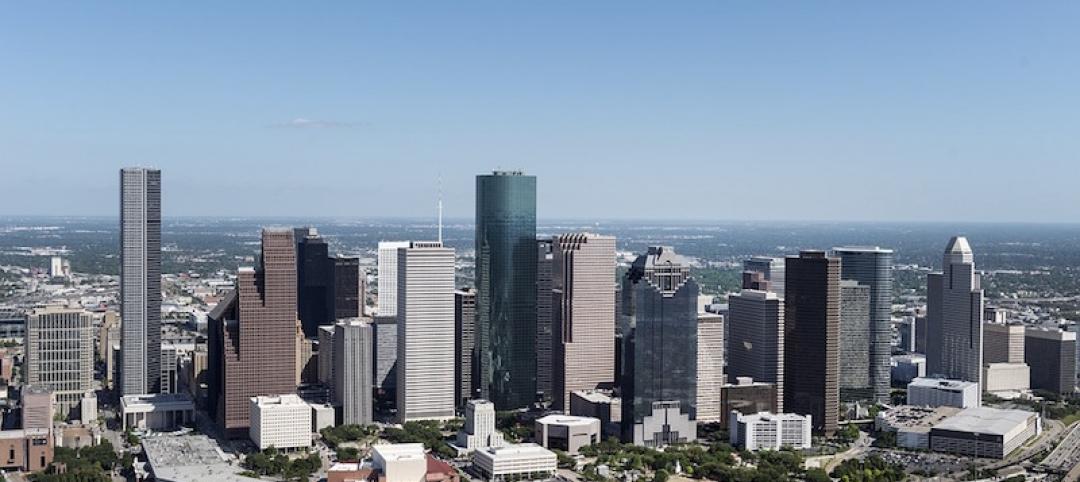
Indexed by building type, construction costs were among the highest in New York for offices, shopping malls, hospitals, single-family homes, and high schools. San Francisco’s construction costs exceeded the other markets RLB tracked for five-star hotels, hospitals, warehouses, parking structures, multifamily homes, high schools, and universities.
Honolulu is the most expensive market in which to build elementary schools. But that market, along with Denver, Las Vegas, Los Angeles, Phoenix, Portland, and Washington DC, experienced overall cost increases between July 1 and October 1 that were less than the national average for that period, according to RLB estimates.
Related Stories

Contractors | Sep 19, 2017
Commercial Construction Index finds high optimism in U.S. commercial construction industry
Hurricane recovery efforts expected to heighten concerns about labor scarcities in the south, where two-thirds of contractors already face worker shortages.
Multifamily Housing | Sep 15, 2017
Hurricane Harvey damaged fewer apartments in greater Houston than estimated
As of Sept. 14, 166 properties reported damage to 8,956 units, about 1.4% of the total supply of apartments, according to ApartmentData.com.
Hotel Facilities | Sep 6, 2017
Marriott has the largest construction pipeline of any franchise company in the U.S.
Marriott has the most rooms currently under construction with 482 Projects/67,434 Rooms.

Market Data | Sep 5, 2017
Nonresidential construction declines again, public and private sector down in July
Weakness in spending was widespread.

Market Data | Aug 29, 2017
Hidden opportunities emerge from construction industry challenges
JLL’s latest construction report shows stability ahead with tech and innovation leading the way.

Market Data | Aug 28, 2017
U.S. hotel construction pipeline is up 7% year-over-year
For the economy, the rate of growth may be low but it’s running on all cylinders.

Market Data | Aug 23, 2017
Architecture Billings Index growth moderates
“The July figures show the continuation of healthy trends in the construction sector of our economy,” said AIA Chief Economist, Kermit Baker.

Architects | Aug 21, 2017
AIA: Architectural salaries exceed gains in the broader economy
AIA’s latest compensation report finds average compensation for staff positions up 2.8% from early 2015.

Market Data | Aug 20, 2017
Some suburban office markets are holding their own against corporate exodus to cities
An analysis of mortgage-backed loans suggests that demand remains relatively steady.
Market Data | Aug 17, 2017
Marcum Commercial Construction Index reports second quarter spending increase in commercial and office construction
Spending in all 12 of the remaining nonresidential construction subsectors retreated on both an annualized and monthly basis.


