


In the 12 months ended December 2021, bid construction costs rose 7.42 percent. “These increases are reminiscent of the sort of cost increases that we saw in the period 2004 to 2007,” wrote Julian Anderson, FRICS, President-North America for the construction advisory firm Rider Levett Bucknall (RLB), which today released its Fourth Quarter 2021 North America Construction Cost Report.
RLB’s National Construction Cost Index for the fourth quarter stood at 225.38, 7.4 percent higher than the Index for the fourth quarter of 2020, and 1.8 percent higher than last year’s third quarter. In his essay for this report, Anderson was optimistic about the eventual positive impact of the recently passed Bipartisan Infrastructure bill on construction and repair.

However, the force of that legislation could be stymied, or at least delayed, by supply chain problems that continue to plague the industry. Bottlenecks at western ports and chronic shortages of skilled labor still contribute to this volatility. Cost increases are also a function of rising inflation, as the Consumer Price Index registered a year-over-year increase of 5.38 percent.
On the positive side, America’s Gross Domestic Product, which measures output, returned to 2.1 percent, which was about where it was in the pre-pandemic fourth quarter of 2019. And the rate of unemployment for the construction sector dipped to 4.5 percent in Q421, versus 9.6 percent in Q420. Construction tracked national unemployment that has also been on a downward trend.
SEVERAL METROS BUCKED QUARTERLY COST TREND
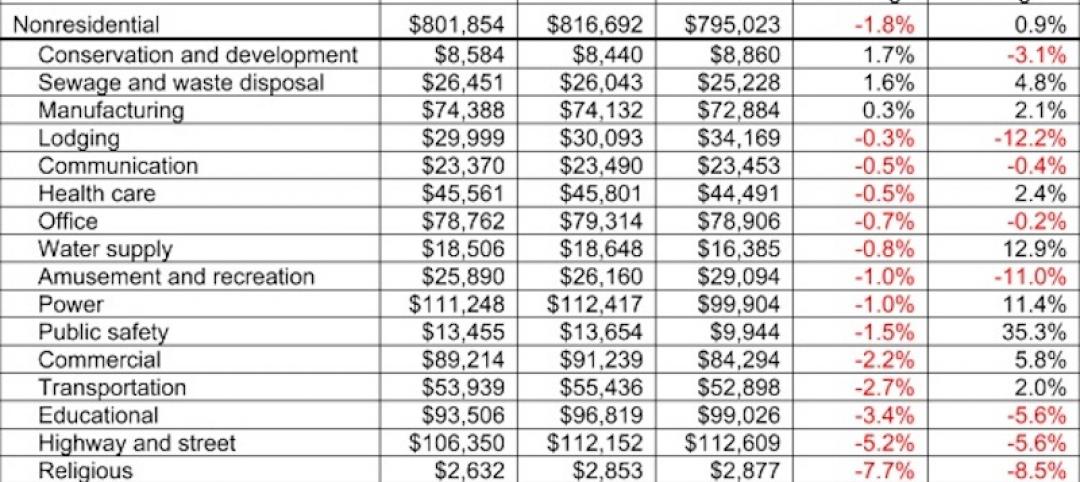
Nonresidential construction spending in November 2021, the latest month for which data were available from the Census Bureau, stood at $820.6 billion, 3.4 percent higher than the same month in 2021. But materials and labor keep getting more expensive, too. RLB’s Comparative Cost Index found that, from October 2020 through October 2021, construction costs rose by 10.09 percent in Seattle, by 9.11 percent in Washington DC, by 9.01 percent in Chicago, by 8.85 percent in Boston, and by 8.51 percent in New York.

Indexed by building type, construction costs were among the highest in New York for offices, shopping malls, hospitals, single-family homes, and high schools. San Francisco’s construction costs exceeded the other markets RLB tracked for five-star hotels, hospitals, warehouses, parking structures, multifamily homes, high schools, and universities.
Honolulu is the most expensive market in which to build elementary schools. But that market, along with Denver, Las Vegas, Los Angeles, Phoenix, Portland, and Washington DC, experienced overall cost increases between July 1 and October 1 that were less than the national average for that period, according to RLB estimates.
Related Stories

Market Data | Jun 2, 2020
Architects, health experts release strategies, tools for safely reopening buildings
AIA issues three new and enhanced tools for reducing risk of COVID-19 transmission in buildings.

Market Data | Jun 2, 2020
5 must reads for the AEC industry today: June 2, 2020
New Luxembourg office complex breaks ground and nonresidential construction spending falls.
Market Data | Jun 1, 2020
Nonresidential construction spending falls in April
Of the 16 subcategories, 13 were down on a monthly basis.
Market Data | Jun 1, 2020
7 must reads for the AEC industry today: June 1, 2020
Energy storage as an amenity and an entry-point for wellness screening everywhere.

Market Data | May 29, 2020
House-passed bill making needed improvements to paycheck protection program will allow construction firms to save more jobs
Construction official urges senate and White House to quickly pass and sign into law the Paycheck Protection Program Flexibility Act.

Market Data | May 29, 2020
7 must reads for the AEC industry today: May 29, 2020
Using lighting IoT data to inform a safer office reentry strategy and Ghafari joins forces with Eview 360.

Market Data | May 27, 2020
5 must reads for the AEC industry today: May 28, 2020
Biophilic design on the High Line and the office market could be a COVID-19 casualty.

Market Data | May 27, 2020
6 must reads for the AEC industry today: May 27, 2020
AIA's COTE Top Ten Awards and OSHA now requires employers to track COVID-19 cases.

Market Data | May 26, 2020
6 must reads for the AEC industry today: May 26, 2020
Apple's new Austin hotel and is CLT really a green solution?

Market Data | May 21, 2020
7 must reads for the AEC industry today: May 21, 2020
'Creepy' tech invades post-pandemic offices, and meet the new darling of commercial real estate.


