


Top Industrial Sector Architecture Firms
| Rank | Company | 2012 Industrial Revenue ($) |
| 1 | Stantec | $69,838,891 |
| 2 | Epstein | $41,368,000 |
| 3 | IBI Group | $24,526,119 |
| 4 | Gresham, Smith and Partners | $11,561,598 |
| 5 | Ware Malcomb | $8,000,000 |
| 6 | Albert Kahn Family of Companies | $7,284,455 |
| 7 | CTA Architects Engineers | $5,764,999 |
| 8 | Heery International | $2,987,000 |
| 9 | Gensler | $2,700,000 |
| 10 | OZ Architecture | $2,563,197 |
| 11 | Reynolds, Smith and Hills | $2,180,000 |
| 12 | Lord, Aeck & Sargent | $2,000,000 |
| 13 | Cooper Carry | $1,540,853 |
| 14 | Wight & Co. | $1,509,600 |
| 15 | Beyer Blinder Belle Architects & Planners | $1,354,582 |
| 16 | LMN Architects | $1,346,300 |
| 17 | Environetics | $1,205,310 |
| 18 | Goodwyn, Mills & Cawood | $1,190,000 |
| 19 | Morris Architects | $1,000,000 |
| 20 | Little | $931,166 |
| 21 | RSP Architects | $655,000 |
| 22 | HOK | $599,000 |
| 23 | KZF Design | $531,700 |
| 24 | Francis Cauffman | $491,448 |
| 25 | Baskervill | $490,000 |
| 26 | Emersion Design | $480,613 |
| 27 | Kirksey Architecture | $423,050 |
| 28 | NELSON | $389,678 |
| 29 | Fletcher-Thompson | $350,000 |
| 30 | VOA Associates | $343,360 |
| 31 | Smallwood, Reynolds, Stewart, Stewart & Associates | $319,164 |
| 32 | Harley Ellis Devereaux | $312,000 |
| 33 | Margulies Perruzzi Architects | $192,597 |
| 34 | TEG Architects - The Estopinal Group | $188,955 |
| 35 | Harvard Jolly Architecture | $155,000 |
| 36 | Mithun | $131,000 |
| 37 | Astorino | $120,000 |
| 38 | JRS Architect | $100,000 |
| 39 | BBS Architects, Landscape Architects and Engineers | $80,000 |
| 40 | Hoffmann Architects | $57,000 |
| 41 | Nadel | $25,000 |
| 42 | S/L/A/M Collaborative, The | $21,000 |
Top Industrial Sector Engineering Firms
| Rank | Company | 2012 Industrial Revenue ($) |
| 1 | Jacobs Engineering Group | $1,661,440,000 |
| 2 | Fluor | $941,395,800 |
| 3 | Science Applications International Corp. | $223,319,845 |
| 4 | Burns & McDonnell | $135,820,000 |
| 5 | SSOE Group | $134,551,851 |
| 6 | Day & Zimmermann | $85,898,442 |
| 7 | URS Corp. | $29,387,108 |
| 8 | Middough | $26,200,000 |
| 9 | Parsons Brinckerhoff | $23,400,000 |
| 10 | Barge, Waggoner, Sumner and Cannon | $22,500,000 |
| 11 | ThermalTech Engineering | $17,000,000 |
| 12 | Hixson Architecture, Engineering, Interiors | $13,000,000 |
| 13 | Glumac | $12,185,000 |
| 14 | BRPH | $8,600,000 |
| 15 | Coffman Engineers | $8,560,000 |
| 16 | Buro Happold Consulting Engineers | $8,140,000 |
| 17 | Michael Baker Jr. | $7,020,000 |
| 18 | Shive-Hattery | $6,537,262 |
| 19 | RMF Engineering Design | $6,500,000 |
| 20 | Affiliated Engineers | $5,876,000 |
| 21 | Stanley Consultants | $5,494,394 |
| 22 | Clark Nexsen | $5,392,460 |
| 23 | Wiss, Janney, Elstner Associates | $5,220,000 |
| 24 | Simpson Gumpertz & Heger | $4,700,000 |
| 25 | Guernsey | $4,557,518 |
| 26 | STV | $4,323,000 |
| 27 | Arup | $3,819,178 |
| 28 | GRAEF | $3,226,776 |
| 29 | Walker Parking Consultants | $3,109,222 |
| 30 | KPFF Consulting Engineers | $3,000,000 |
| 31 | Rolf Jensen & Associates | $2,800,000 |
| 32 | Bridgers & Paxton Consulting Engineers | $2,699,020 |
| 33 | Degenkolb Engineers | $2,671,410 |
| 34 | M/E Engineering | $2,268,700 |
| 35 | P2S Engineering | $2,072,765 |
| 36 | Wick Fisher White | $1,706,660 |
| 37 | H.F. Lenz | $1,651,500 |
| 38 | Vanderweil Engineers | $1,506,400 |
| 39 | Karpinski Engineering | $1,501,339 |
| 40 | Walter P Moore | $1,396,638 |
| 41 | RDK Engineers | $1,390,000 |
| 42 | Smith Seckman Reid | $1,379,596 |
| 43 | Environmental Systems Design | $1,231,537 |
| 44 | Bard, Rao + Athanas Consulting Engineers | $1,200,000 |
| 45 | Dewberry | $1,078,946 |
| 46 | Aon Fire Protection Engineering | $1,000,000 |
| 47 | Bergmann Associates | $978,000 |
| 48 | Interface Engineering | $772,541 |
| 49 | Heapy Engineering | $621,450 |
| 50 | Haynes Whaley Associates | $617,753 |
| 51 | CTLGroup | $600,000 |
| 52 | TLC Engineering for Architecture | $591,145 |
| 53 | KCI Technologies | $500,000 |
| 53 | OLA Consulting Engineers | $500,000 |
| 55 | Ross & Baruzzini | $444,145 |
| 56 | WSP USA | $424,888 |
| 57 | Spectrum Engineers | $360,250 |
| 58 | Eaton Energy Solutions | $339,690 |
| 59 | Henderson Engineers | $310,850 |
| 60 | Magnusson Klemencic Associates | $308,547 |
| 61 | Dunham Associates | $250,000 |
| 62 | CJL Engineering | $233,871 |
| 63 | Total Building Commissioning | $153,300 |
| 64 | FBA Engineering | $150,000 |
| 64 | Paulus, Sokolowski and Sartor | $150,000 |
| 66 | Thornton Tomasetti | $114,733 |
| 67 | Bala Consulting Engineers | $90,000 |
| 68 | Allen & Shariff | $82,000 |
| 69 | Wallace Engineering | $80,000 |
| 70 | Brinjac Engineering | $74,633 |
| 71 | Davis, Bowen & Friedel | $43,859 |
| 72 | Newcomb & Boyd | $27,132 |
| 73 | Mazzetti | $18,116 |
| 74 | Kamm Consulting | $7,850 |
Top Industrial Sector Construction Firms
| Rank | Company | 2012 Industrial Revenue ($) |
| 1 | Hoffman Construction | $1,819,000,000 |
| 2 | Turner Corporation, The | $1,401,180,000 |
| 3 | Walbridge | $871,700,000 |
| 4 | Skanska USA | $721,970,708 |
| 5 | Yates Cos., The | $554,100,000 |
| 6 | Clayco | $418,560,000 |
| 7 | Haskell | $404,238,226 |
| 8 | Gray | $386,754,302 |
| 9 | Boldt Company, The | $321,318,959 |
| 10 | Whiting-Turner Contracting Co., The | $298,795,347 |
| 11 | Alberici Constructors | $294,207,307 |
| 12 | McShane Cos., The | $288,418,222 |
| 13 | Barton Malow | $253,102,625 |
| 14 | Tutor Perini Corporation | $215,474,425 |
| 15 | Ryan Companies US | $206,052,076 |
| 16 | Brasfield & Gorrie | $205,343,342 |
| 17 | Clark Group | $191,681,422 |
| 18 | Gilbane | $159,494,000 |
| 19 | Graycor | $135,341,242 |
| 20 | McGough | $100,550,000 |
| 21 | McCarthy Holdings | $81,000,000 |
| 21 | Robins & Morton | $81,000,000 |
| 23 | Weitz Co., The | $79,140,402 |
| 24 | Layton Construction | $79,100,000 |
| 25 | Lend Lease | $74,602,000 |
| 26 | Choate Construction | $73,961,774 |
| 27 | Clancy & Theys Construction | $48,710,000 |
| 28 | Hill & Wilkinson General Contractors | $46,977,243 |
| 29 | Messer Construction | $46,733,962 |
| 30 | Pepper Construction Group | $45,901,000 |
| 31 | O'Neil Industries/W.E. O'Neil | $43,711,941 |
| 32 | B. L. Harbert International | $40,698,755 |
| 33 | Structure Tone | $39,024,000 |
| 34 | Hunt Construction Group | $36,000,000 |
| 35 | Batson-Cook | $32,472,556 |
| 36 | Kraus-Anderson Construction | $30,000,000 |
| 37 | Hensel Phelps | $26,450,000 |
| 38 | PCL Construction Enterprises | $26,010,554 |
| 39 | James McHugh Construction | $20,634,215 |
| 40 | IMC Construction | $19,149,000 |
| 41 | Austin Commercial | $17,113,101 |
| 42 | S. M. Wilson & Co. | $14,603,743 |
| 43 | LPCiminelli | $13,527,920 |
| 44 | DPR Construction | $11,096,257 |
| 45 | Coakley & Williams Construction | $9,767,527 |
| 46 | Manhattan Construction | $8,768,000 |
| 47 | JE Dunn Construction | $8,733,578 |
| 48 | CORE Construction Group | $7,893,895 |
| 49 | Hoar Construction | $6,742,000 |
| 50 | Jones Lang LaSalle | $6,258,100 |
| 51 | W. M. Jordan Co. | $4,164,713 |
| 52 | Bernards | $4,000,000 |
| 53 | New South Construction | $2,900,000 |
| 54 | ECC | $2,838,907 |
| 55 | Walsh Group, The | $2,301,449 |
| 56 | Bette Companies, The | $1,000,000 |
| 56 | Power Construction | $1,000,000 |
| 58 | Stalco Construction | $950,000 |
| 59 | Doster Construction | $399,644 |
Read the full 2013 Giants 300 Report
Related Stories
| Dec 17, 2010
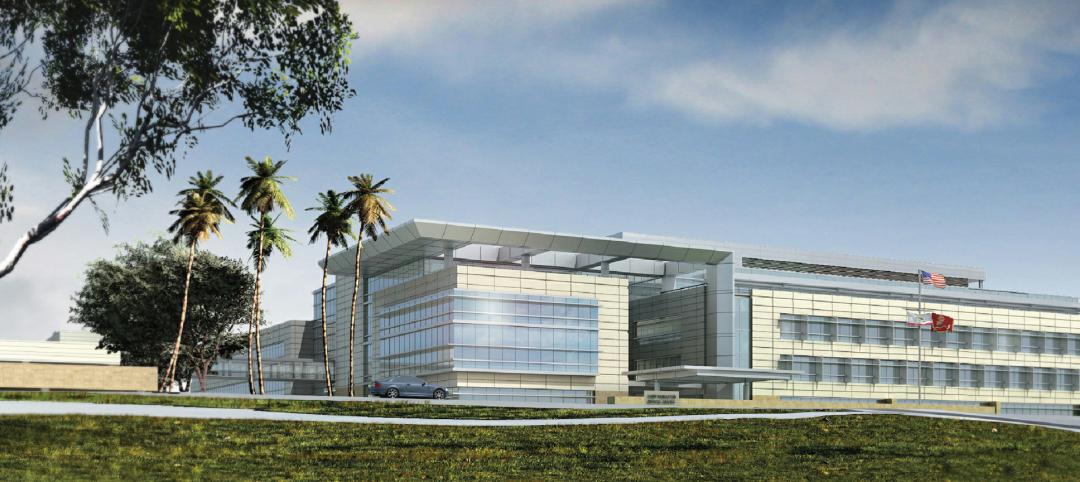
ARRA-funded Navy hospital aims for LEED Gold
The team of Clark/McCarthy, HKS Architects, and Wingler & Sharp are collaborating on the design of a new naval hospital at Camp Pendleton in Southern California. The $451 million project is the largest so far awarded by the U.S. Navy under the American Recovery and Reinvestment Act. The 500,000-sf, 67-bed hospital, to be located on a 70-acre site, will include facilities for emergency and primary care, specialty care clinics, surgery, and intensive care. The Building Team is targeting LEED Gold.
| Dec 17, 2010
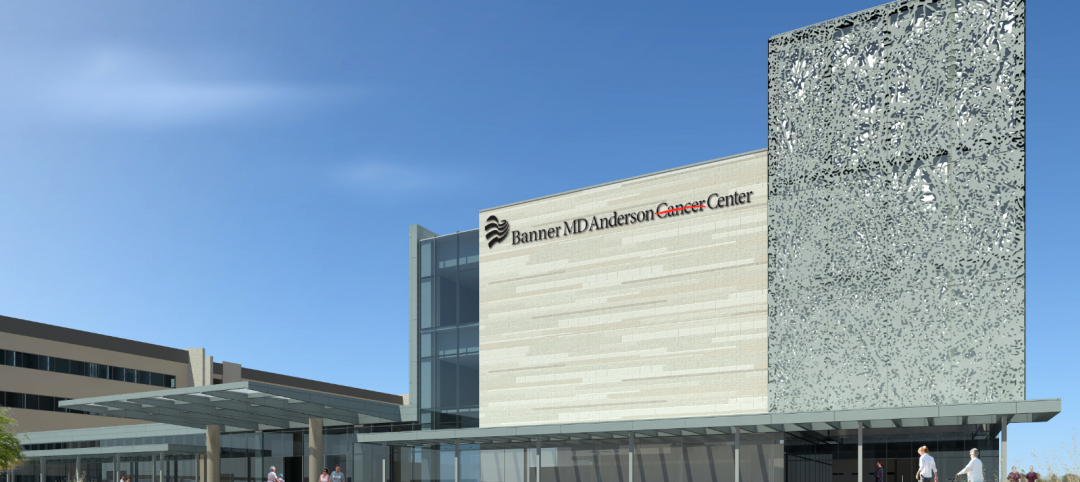
Arizona outpatient cancer center to light a ‘lantern of hope’
Construction of the Banner MD Anderson Cancer Center in Gilbert, Ariz., is under way. Located on the Banner Gateway Medical Center campus near Phoenix, the three-story, 131,000-sf outpatient facility will house radiation oncology, outpatient imaging, multi-specialty clinics, infusion therapy, and various support services. Cannon Design incorporated a signature architectural feature called the “lantern of hope” for the $90 million facility.
| Dec 17, 2010
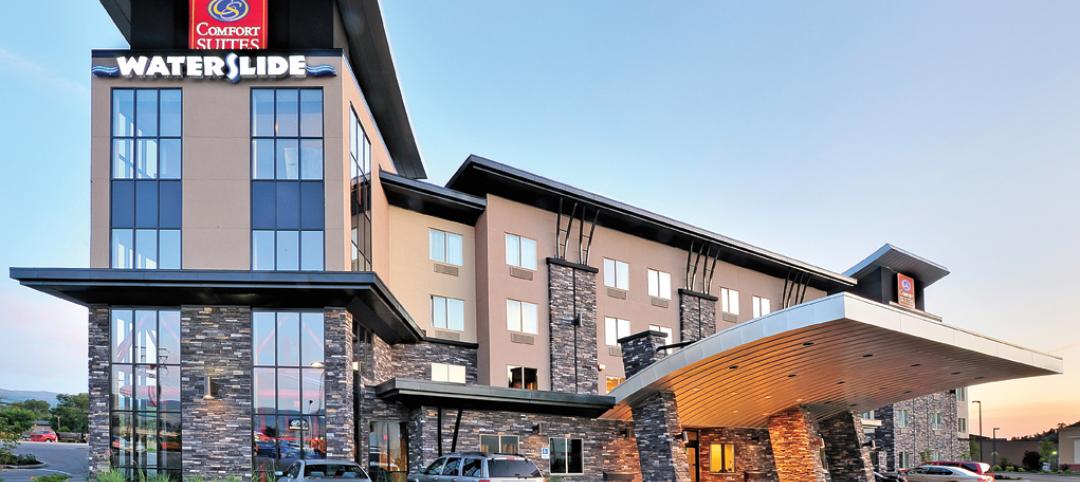
Cladding Do’s and Don’ts
A veteran structural engineer offers expert advice on how to avoid problems with stone cladding and glass/aluminum cladding systems.
| Dec 17, 2010
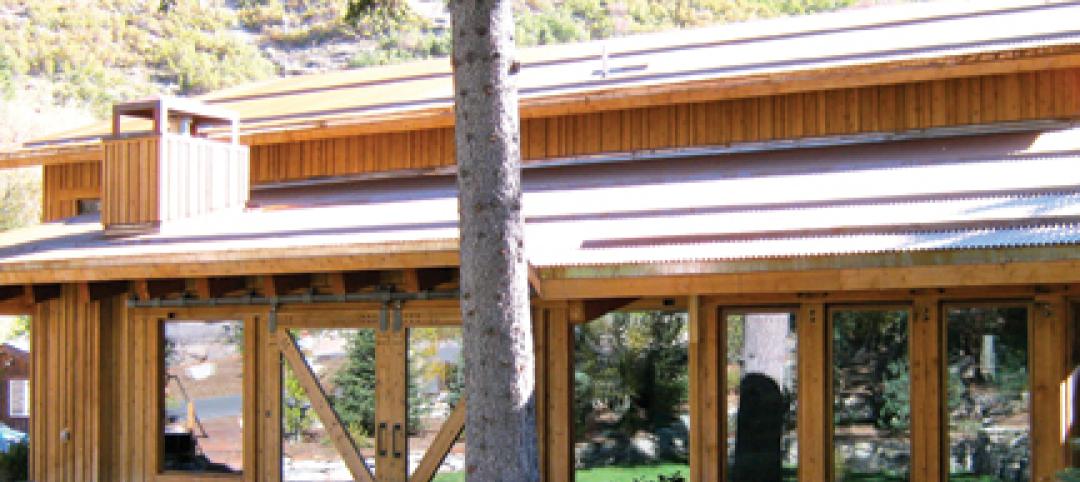
5 Tips on Building with SIPs
Structural insulated panels are gaining the attention of Building Teams interested in achieving high-performance building envelopes in commercial, industrial, and institutional projects.
| Dec 17, 2010
How to Win More University Projects
University architects representing four prominent institutions of higher learning tell how your firm can get the inside track on major projects.

| Dec 13, 2010
Energy efficiency No. 1 priority for commercial office tenants
Green building initiatives are a key influencer when tenants decide to sign a commercial real estate lease, according to a survey by GE Capital Real Estate. The survey, which was conducted over the past year and included more than 2,220 office tenants in the U.S., Canada, France, Germany, Sweden, the UK, Spain, and Japan, shows that energy efficiency remains the No. 1 priority in most countries. Also ranking near the top: waste reduction programs and indoor air.
| Dec 7, 2010
Are green building RFPs more important than contracts?
The Request for Proposal (RFP) process is key to managing a successful LEED project, according to Green Building Law Update. While most people think a contract is the key element to a successful construction project, successfully managing a LEED project requires a clear RFP that addresses many of the problems that can lead to litigation.
| Dec 7, 2010
Blue is the future of green design
Blue design creates places that are not just neutral, but actually add back to the world and is the future of sustainable design and architecture, according to an interview with Paul Eagle, managing director of Perkins+Will, New York; and Janice Barnes, principal at the firm and global discipline leader for planning and strategies.
| Dec 7, 2010
Green building thrives in shaky economy
Green building’s momentum hasn’t been stopped by the economic recession and will keep speeding through the recovery, while at the same time building owners are looking to go green more for economic reasons than environmental ones. Green building has grown 50% in the past two years; total construction starts have shrunk 26% over the same time period, according to “Green Outlook 2011” report. The green-building sector is expected to nearly triple by 2015, representing as much as $145 billion in new construction activity.


