


Top Industrial Sector Architecture Firms
| Rank | Company | 2012 Industrial Revenue ($) |
| 1 | Stantec | $69,838,891 |
| 2 | Epstein | $41,368,000 |
| 3 | IBI Group | $24,526,119 |
| 4 | Gresham, Smith and Partners | $11,561,598 |
| 5 | Ware Malcomb | $8,000,000 |
| 6 | Albert Kahn Family of Companies | $7,284,455 |
| 7 | CTA Architects Engineers | $5,764,999 |
| 8 | Heery International | $2,987,000 |
| 9 | Gensler | $2,700,000 |
| 10 | OZ Architecture | $2,563,197 |
| 11 | Reynolds, Smith and Hills | $2,180,000 |
| 12 | Lord, Aeck & Sargent | $2,000,000 |
| 13 | Cooper Carry | $1,540,853 |
| 14 | Wight & Co. | $1,509,600 |
| 15 | Beyer Blinder Belle Architects & Planners | $1,354,582 |
| 16 | LMN Architects | $1,346,300 |
| 17 | Environetics | $1,205,310 |
| 18 | Goodwyn, Mills & Cawood | $1,190,000 |
| 19 | Morris Architects | $1,000,000 |
| 20 | Little | $931,166 |
| 21 | RSP Architects | $655,000 |
| 22 | HOK | $599,000 |
| 23 | KZF Design | $531,700 |
| 24 | Francis Cauffman | $491,448 |
| 25 | Baskervill | $490,000 |
| 26 | Emersion Design | $480,613 |
| 27 | Kirksey Architecture | $423,050 |
| 28 | NELSON | $389,678 |
| 29 | Fletcher-Thompson | $350,000 |
| 30 | VOA Associates | $343,360 |
| 31 | Smallwood, Reynolds, Stewart, Stewart & Associates | $319,164 |
| 32 | Harley Ellis Devereaux | $312,000 |
| 33 | Margulies Perruzzi Architects | $192,597 |
| 34 | TEG Architects - The Estopinal Group | $188,955 |
| 35 | Harvard Jolly Architecture | $155,000 |
| 36 | Mithun | $131,000 |
| 37 | Astorino | $120,000 |
| 38 | JRS Architect | $100,000 |
| 39 | BBS Architects, Landscape Architects and Engineers | $80,000 |
| 40 | Hoffmann Architects | $57,000 |
| 41 | Nadel | $25,000 |
| 42 | S/L/A/M Collaborative, The | $21,000 |
Top Industrial Sector Engineering Firms
| Rank | Company | 2012 Industrial Revenue ($) |
| 1 | Jacobs Engineering Group | $1,661,440,000 |
| 2 | Fluor | $941,395,800 |
| 3 | Science Applications International Corp. | $223,319,845 |
| 4 | Burns & McDonnell | $135,820,000 |
| 5 | SSOE Group | $134,551,851 |
| 6 | Day & Zimmermann | $85,898,442 |
| 7 | URS Corp. | $29,387,108 |
| 8 | Middough | $26,200,000 |
| 9 | Parsons Brinckerhoff | $23,400,000 |
| 10 | Barge, Waggoner, Sumner and Cannon | $22,500,000 |
| 11 | ThermalTech Engineering | $17,000,000 |
| 12 | Hixson Architecture, Engineering, Interiors | $13,000,000 |
| 13 | Glumac | $12,185,000 |
| 14 | BRPH | $8,600,000 |
| 15 | Coffman Engineers | $8,560,000 |
| 16 | Buro Happold Consulting Engineers | $8,140,000 |
| 17 | Michael Baker Jr. | $7,020,000 |
| 18 | Shive-Hattery | $6,537,262 |
| 19 | RMF Engineering Design | $6,500,000 |
| 20 | Affiliated Engineers | $5,876,000 |
| 21 | Stanley Consultants | $5,494,394 |
| 22 | Clark Nexsen | $5,392,460 |
| 23 | Wiss, Janney, Elstner Associates | $5,220,000 |
| 24 | Simpson Gumpertz & Heger | $4,700,000 |
| 25 | Guernsey | $4,557,518 |
| 26 | STV | $4,323,000 |
| 27 | Arup | $3,819,178 |
| 28 | GRAEF | $3,226,776 |
| 29 | Walker Parking Consultants | $3,109,222 |
| 30 | KPFF Consulting Engineers | $3,000,000 |
| 31 | Rolf Jensen & Associates | $2,800,000 |
| 32 | Bridgers & Paxton Consulting Engineers | $2,699,020 |
| 33 | Degenkolb Engineers | $2,671,410 |
| 34 | M/E Engineering | $2,268,700 |
| 35 | P2S Engineering | $2,072,765 |
| 36 | Wick Fisher White | $1,706,660 |
| 37 | H.F. Lenz | $1,651,500 |
| 38 | Vanderweil Engineers | $1,506,400 |
| 39 | Karpinski Engineering | $1,501,339 |
| 40 | Walter P Moore | $1,396,638 |
| 41 | RDK Engineers | $1,390,000 |
| 42 | Smith Seckman Reid | $1,379,596 |
| 43 | Environmental Systems Design | $1,231,537 |
| 44 | Bard, Rao + Athanas Consulting Engineers | $1,200,000 |
| 45 | Dewberry | $1,078,946 |
| 46 | Aon Fire Protection Engineering | $1,000,000 |
| 47 | Bergmann Associates | $978,000 |
| 48 | Interface Engineering | $772,541 |
| 49 | Heapy Engineering | $621,450 |
| 50 | Haynes Whaley Associates | $617,753 |
| 51 | CTLGroup | $600,000 |
| 52 | TLC Engineering for Architecture | $591,145 |
| 53 | KCI Technologies | $500,000 |
| 53 | OLA Consulting Engineers | $500,000 |
| 55 | Ross & Baruzzini | $444,145 |
| 56 | WSP USA | $424,888 |
| 57 | Spectrum Engineers | $360,250 |
| 58 | Eaton Energy Solutions | $339,690 |
| 59 | Henderson Engineers | $310,850 |
| 60 | Magnusson Klemencic Associates | $308,547 |
| 61 | Dunham Associates | $250,000 |
| 62 | CJL Engineering | $233,871 |
| 63 | Total Building Commissioning | $153,300 |
| 64 | FBA Engineering | $150,000 |
| 64 | Paulus, Sokolowski and Sartor | $150,000 |
| 66 | Thornton Tomasetti | $114,733 |
| 67 | Bala Consulting Engineers | $90,000 |
| 68 | Allen & Shariff | $82,000 |
| 69 | Wallace Engineering | $80,000 |
| 70 | Brinjac Engineering | $74,633 |
| 71 | Davis, Bowen & Friedel | $43,859 |
| 72 | Newcomb & Boyd | $27,132 |
| 73 | Mazzetti | $18,116 |
| 74 | Kamm Consulting | $7,850 |
Top Industrial Sector Construction Firms
| Rank | Company | 2012 Industrial Revenue ($) |
| 1 | Hoffman Construction | $1,819,000,000 |
| 2 | Turner Corporation, The | $1,401,180,000 |
| 3 | Walbridge | $871,700,000 |
| 4 | Skanska USA | $721,970,708 |
| 5 | Yates Cos., The | $554,100,000 |
| 6 | Clayco | $418,560,000 |
| 7 | Haskell | $404,238,226 |
| 8 | Gray | $386,754,302 |
| 9 | Boldt Company, The | $321,318,959 |
| 10 | Whiting-Turner Contracting Co., The | $298,795,347 |
| 11 | Alberici Constructors | $294,207,307 |
| 12 | McShane Cos., The | $288,418,222 |
| 13 | Barton Malow | $253,102,625 |
| 14 | Tutor Perini Corporation | $215,474,425 |
| 15 | Ryan Companies US | $206,052,076 |
| 16 | Brasfield & Gorrie | $205,343,342 |
| 17 | Clark Group | $191,681,422 |
| 18 | Gilbane | $159,494,000 |
| 19 | Graycor | $135,341,242 |
| 20 | McGough | $100,550,000 |
| 21 | McCarthy Holdings | $81,000,000 |
| 21 | Robins & Morton | $81,000,000 |
| 23 | Weitz Co., The | $79,140,402 |
| 24 | Layton Construction | $79,100,000 |
| 25 | Lend Lease | $74,602,000 |
| 26 | Choate Construction | $73,961,774 |
| 27 | Clancy & Theys Construction | $48,710,000 |
| 28 | Hill & Wilkinson General Contractors | $46,977,243 |
| 29 | Messer Construction | $46,733,962 |
| 30 | Pepper Construction Group | $45,901,000 |
| 31 | O'Neil Industries/W.E. O'Neil | $43,711,941 |
| 32 | B. L. Harbert International | $40,698,755 |
| 33 | Structure Tone | $39,024,000 |
| 34 | Hunt Construction Group | $36,000,000 |
| 35 | Batson-Cook | $32,472,556 |
| 36 | Kraus-Anderson Construction | $30,000,000 |
| 37 | Hensel Phelps | $26,450,000 |
| 38 | PCL Construction Enterprises | $26,010,554 |
| 39 | James McHugh Construction | $20,634,215 |
| 40 | IMC Construction | $19,149,000 |
| 41 | Austin Commercial | $17,113,101 |
| 42 | S. M. Wilson & Co. | $14,603,743 |
| 43 | LPCiminelli | $13,527,920 |
| 44 | DPR Construction | $11,096,257 |
| 45 | Coakley & Williams Construction | $9,767,527 |
| 46 | Manhattan Construction | $8,768,000 |
| 47 | JE Dunn Construction | $8,733,578 |
| 48 | CORE Construction Group | $7,893,895 |
| 49 | Hoar Construction | $6,742,000 |
| 50 | Jones Lang LaSalle | $6,258,100 |
| 51 | W. M. Jordan Co. | $4,164,713 |
| 52 | Bernards | $4,000,000 |
| 53 | New South Construction | $2,900,000 |
| 54 | ECC | $2,838,907 |
| 55 | Walsh Group, The | $2,301,449 |
| 56 | Bette Companies, The | $1,000,000 |
| 56 | Power Construction | $1,000,000 |
| 58 | Stalco Construction | $950,000 |
| 59 | Doster Construction | $399,644 |
Read the full 2013 Giants 300 Report
Related Stories

Sponsored | | Jan 3, 2018
4 networking strategies to grow your business
Follow these networking strategies to grow your architectural business with the work that you want.

BD+C University Course | Jan 2, 2018
The art and science of rendering: Visualization that sells architecture [AIA course]
3D artist Ramy Hanna offers guidelines and tricks-of-the-trade to ensure that project artwork is a stunning depiction of the unbuilt space.
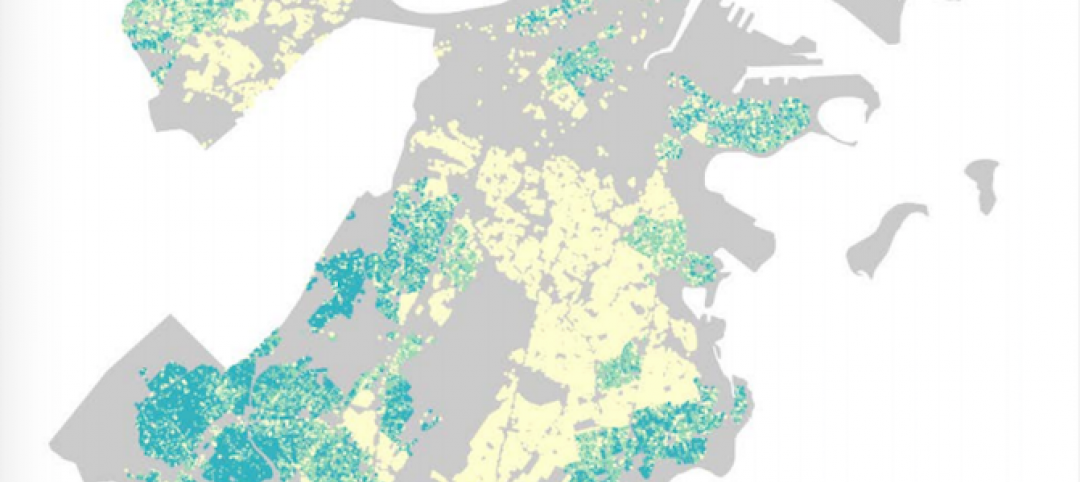
Green | Dec 22, 2017
Green builders can use ‘big data’ to make design decisions
More and more, green project teams are relying on publicly available “external datasets” to prioritize sustainable design decisions, says sustainability consultant Adele Houghton.

Reconstruction & Renovation | Dec 21, 2017
Interactive map includes detailed information on historic New York City buildings
The New York City Landmarks Preservation Commission launched a new, enhanced version of its interactive map, Discover NYC Landmarks.

High-rise Construction | Dec 20, 2017
Another record year for high-rise construction
More than 140 skyscrapers were completed across the globe this year, including 15 supertall towers.

Game Changers | Dec 20, 2017
Urban farms can help plant seeds for cities’ growth around them
Urban farms have been impacting cities’ agribusiness—and, on some cases, their redevelopment—for decades.
 reported the November ABI score was 55.0, up from a score of 51.7 in the previous month. Photo: Pixabay")
Market Data | Dec 20, 2017
Architecture billings upturn shows broad strength
The American Institute of Architects (AIA) reported the November ABI score was 55.0, up from a score of 51.7 in the previous month.
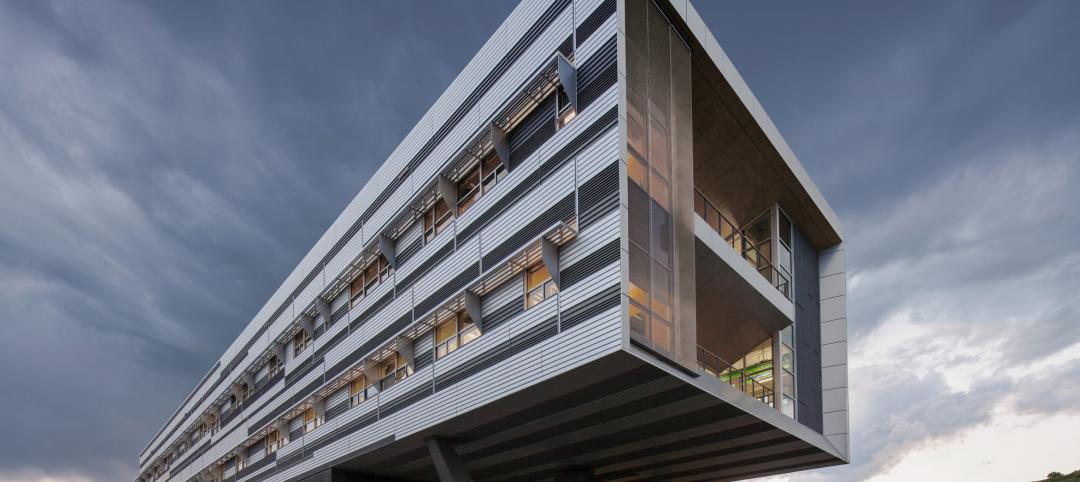
Public Health Labs | Dec 19, 2017
10 takeaways from SmithGroup’s ‘lab of the future’ initiative
The LAB2050 initiative digs into the scientific trends, technologies, and economics that will shape tomorrow’s research laboratory environments.
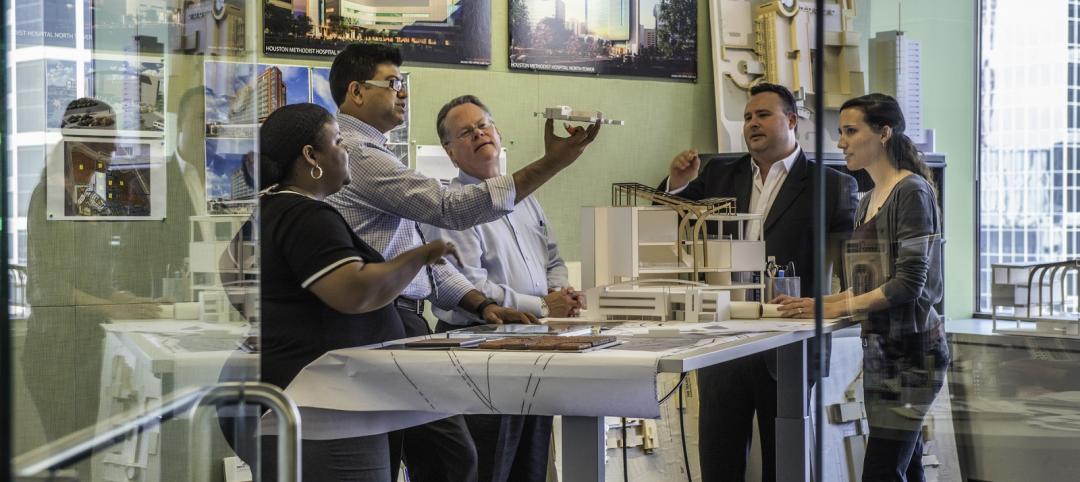
Office Buildings | Dec 19, 2017
How do we measure human performance, and what does it mean for the workplace?
There are many new tools and methods that are beginning to look more comprehensively to evaluate organizational well-being.
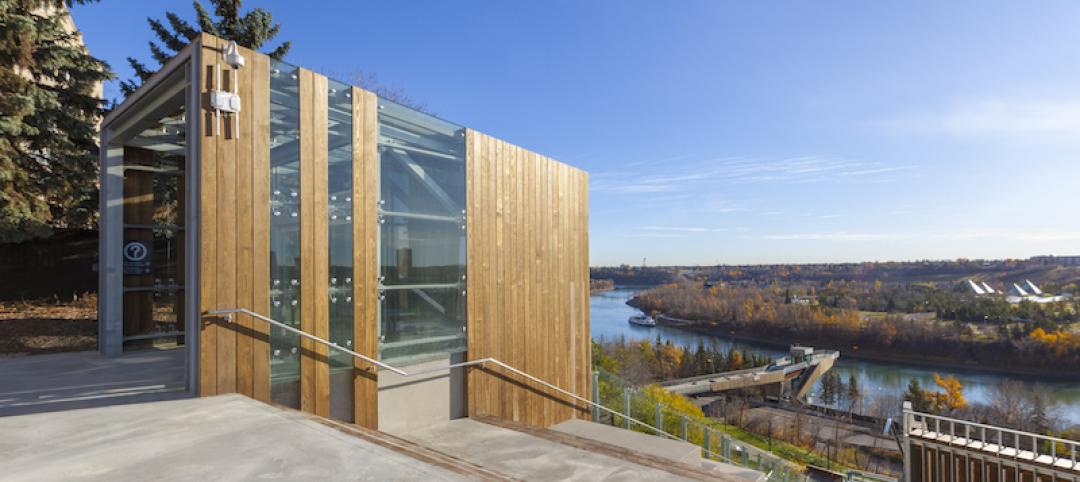
Sports and Recreational Facilities | Dec 18, 2017
Canada’s newest funicular makes Edmonton’s largest green space more accessible
The incline elevator is located in downtown Edmonton and was publicly funded.


