


Grumman/Butkus Associates, a firm of energy efficiency consultants and sustainable design engineers, recently released the results of its 2016 Hospital Energy and Water Benchmarking Survey, focusing on healthcare facilities’ resource usage trends and costs for calendar year 2015.
Since G/BA initiated the survey more than 20 years ago, hospitals’ overall fossil fuel use has trended downward, but electricity use isn’t declining as much. The average combined Btu/ft2 (electricity plus gas/steam) for participating facilities was 237,998 in CY2015, slightly down from 239,591 in CY2014.
Square-foot prices for gas/steam were down significantly year-to-year ($0.82 in 2015, compared with $1.02 in 2014), but square-foot prices for electricity rose ($2.28 in 2015, vs. $2.16 in 2014). The overall result is that hospitals’ total ft2 costs for energy (gas/steam plus electric) declined: $3.11 for 2015, compared with $3.18 for 2014.
Hospitals’ average carbon footprint has remained fairly steady at about 60 pounds of CO2 equivalent per ft2 per year since G/BA began calculating carbon data in 1999. “If we are going to address the very daunting issue of climate change, the healthcare industry must make greater strides in reducing its carbon footprint,” says Dan Doyle, G/BA Chairman. “As the trend data shows, not enough progress is being made so far.”
Participating facilities displayed a broad range of usage patterns. For instance, some participants are using more than 200,000 BTU/ft2 in fossil fuel annually, compared with a general mid-range of facilities (about 130,000 BTU/ft2/year) and those that used least (75,000 BTU/ft2/year or less). Similarly, a few hospitals consume more than 40 kWh/ft2/year in electricity, compared with a mid-range of about 25 kWh/ft2/year. A few squeaked by with less than 18 kWh/ft2.
“Facilities that have high unit costs for energy should view this as an opportunity,” says Doyle. “For example, an energy conservation project that would have a five-year payback at an ‘average’ facility may have a payback of just 2.5 or 3 years at a facility with higher unit costs for energy.”
Hospital water/sewer use is also gradually declining, currently averaging about 45 gallons per square foot per year (compared with nearly 70 gallons/ ft2/year a decade ago). Costs for water/sewer are rising, however, now averaging $0.39/ft2. As recently as 2007, hospitals were paying about $0.27/ft2. “G/BA expects the trend of rising water and sewer costs to continue,” says Doyle. “Price hikes not only reflect increasing costs to extract and treat the water, but also the fact that cash-strapped governmental entities may view water as a revenue source.”
Since 1995, the G/BA survey has provided a free annual benchmarking resource. Hospitals are invited to participate by submitting responses to a short list of questions. Information for this edition was provided by 137 hospitals located in Illinois (56), Wisconsin (31), Michigan (29), Indiana (10), and six other states.
Full results and analysis, as well as information about participating in the 2017 survey (2016 data), are available at the firm’s website: grummanbutkus.com/HES. For additional information, contact Dan Doyle (ddoyle@grummanbutkus.com) or Julie Higginbotham (jhigginbotham@grummanbutkus.c
Related Stories
Market Data | Apr 29, 2020
5 must reads for the AEC industry today: April 29, 2020
A new Human performance Center and Construction employment declines in 99 metro areas.

Market Data | Apr 29, 2020
Construction employment declines in 99 metro areas in March from 2019
Industry officials call for new state and federal funding to add jobs.

Market Data | Apr 28, 2020
5 must reads for the AEC industry today: April 28, 2020
A virtual 'city-forest' to help solve population density challenges and planning for life in cities after the pandemic.

Market Data | Apr 27, 2020
5 must reads for the AEC industry today: April 27, 2020
Colleges begin building campus eSports arenas and PCL Construction rolls out portable coronavirus testing centers.

Market Data | Apr 24, 2020
6 must reads for the AEC industry today: April 24, 2020
Take a virtual tour of Frank Lloyd Wright's Robie House and Construction Contractor Confidence plummets.

Market Data | Apr 23, 2020
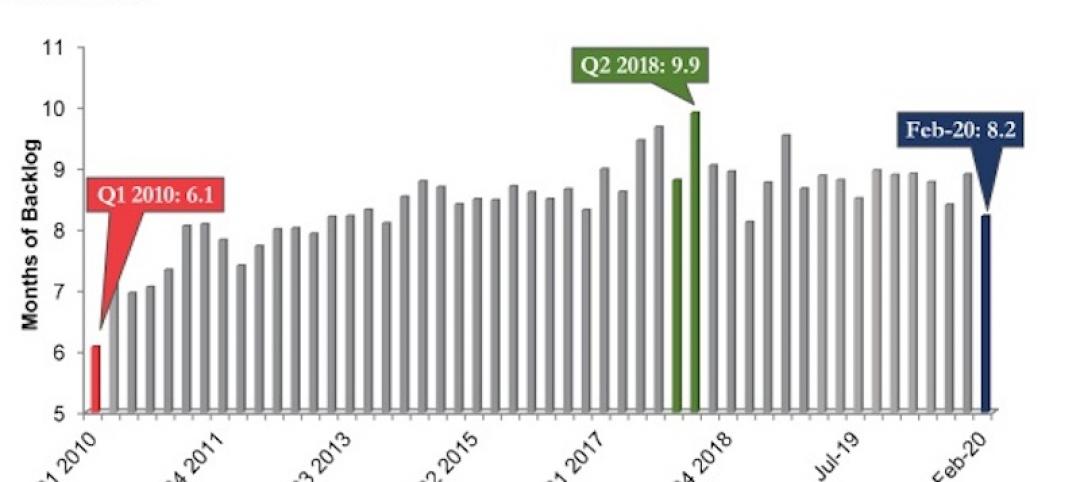
Construction Contractor Confidence plummets in February
As of February 2020, fewer than 30% of contractors expected their sales to increase over the next six months.

Market Data | Apr 23, 2020
5 must reads for the AEC industry today: April 23, 2020
The death of the department store and how to return to work when the time comes.
Market Data | Apr 22, 2020
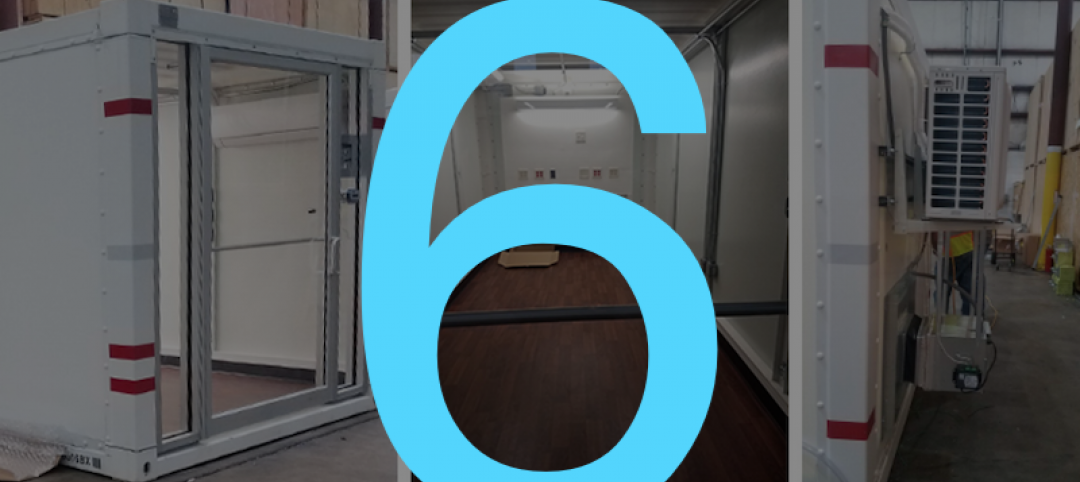
6 must reads for the AEC industry today: April 22, 2020
Repurposed containers can be used as rapid response airborne infection isolation rooms and virtual site visits help control infection on project sites.
Market Data | Apr 21, 2020
ABC's Construction Backlog Indicator down in February
Backlog for firms working in the infrastructure segment rose by 1.3 months in February while backlog for commercial and institutional and heavy industrial firms declined by 0.6 months and 0.7 months, respectively.

Market Data | Apr 21, 2020
5 must reads for the AEC industry today: April 21, 2020
IoT system helps contractors keep their distance and the multifamily market flattens.


