


An analysis of Dun & Bradstreet stats by consultant Paul Abramson indicates that some $11 billion was spent on higher ed construction last year—up a billion from 2012, with nearly 70% comprising new buildings (http://bit.ly/1qhMzaw).
As examined in BD+C’s in-depth May report, university stakeholders face complicated cap-ex stressors, from chronic (lender stinginess, deferred maintenance) to impending (President Obama’s pledge to start rating colleges on value delivered, consumer pushback on ever-rising costs).
Creative approaches to financing, design, and delivery are top-of-mind. Paula Stamp, Business Development Manager in the Los Angeles office of PCL Construction, says clients are exploring CM at risk, design-build, and design risk. Margie Simmons, VP and Education Sector Leader at Stantec, adds: “Higher debt levels will encourage institutions to seek off-balance-sheet financing solutions and P3s.”
Teri Jones, VP at Sundt Construction, sees a similar pattern, plus emphasis on revenue-generating buildings like dorms and recreation centers.
Facility trends observed by Stamp include housing construction by community colleges (serving a growing international-student population) and better use of indoor and outdoor circulation and common space. John Baxter, Education Sector Leader at EYP, says clients are asking for features that enhance an interactive “corridor culture” in dorms.
Michael Medici, AIA, NCARB, Learning Practice Leader and Senior VP at SmithGroupJJR, mentions growing demand for facilities that support interprofessional health sciences education and project-based, career-oriented learning. Also gaining traction: office zones that mimic private-sector workplaces, with less assigned space and more team zones.
Perkins+Will higher ed designers Jeff Ziebarth, Jeff Stebar, and John Long are also seeing this pattern; Long says younger faculty and administrators have been a lot more receptive than veterans.
Top University Sector Architecture Firms
| Rank | Company | 2013 Higher Ed Revenue |
| 1 | CannonDesign | $76,000,000 |
| 2 | Perkins+will | 45,582,532 |
| 3 | Stantec | 42,368,888 |
| 4 | EYP Architecture & Engineering | 39,000,000 |
| 5 | Gensler | 29,492,000 |
| 6 | SmithGroupJJR | 27,088,190 |
| 7 | Clark Nexsen | 21,732,694 |
| 8 | Skidmore, Owings & Merrill | 20,933,579 |
| 9 | Page | 19,771,000 |
| 10 | ZGF Architects | 19,397,489 |
| 11 | Wilson Architects | 18,500,000 |
| 12 | Ennead Architects | 18,086,505 |
| 13 | Flad Architects | 16,260,000 |
| 14 | SHW Group | 15,991,000 |
| 15 | Shepley Bulfinch | 15,595,000 |
| 16 | Harley Ellis Devereaux | 15,120,000 |
| 17 | Moseley Architects | 15,016,516 |
| 18 | Lord Aeck Sargent | 13,533,882 |
| 19 | HMC Architects | 13,440,933 |
| 20 | NBBJ | 13,242,000 |
| 21 | HKS | 12,847,559 |
| 22 | Ballinger | 12,113,215 |
| 23 | Beyer Blinder Belle | 11,627,926 |
| 24 | DLR Group | 11,100,000 |
| 25 | LS3P | 10,532,964 |
| 26 | Morris Architects | 10,000,000 |
| 27 | Solomon Cordwell Buenz | 10,000,000 |
| 28 | Davis Brody Bond | 9,835,655 |
| 29 | FGM Architects | 9,821,820 |
| 30 | LPA | 9,561,760 |
| 31 | Perkins Eastman | 9,300,000 |
| 32 | Moody Nolan | 9,104,965 |
| 33 | CO Architects | 8,912,400 |
| 34 | EwingCole | 7,430,000 |
| 35 | Heery International | 7,186,274 |
| 36 | Hastings+Chivetta Architects | 6,378,602 |
| 37 | Westlake Reed Leskosky | 6,325,000 |
| 38 | FXFOWLE Architects | 6,200,000 |
| 39 | Mithun | 6,158,000 |
| 40 | Goodwyn Mills & Cawood | 6,127,329 |
| 41 | HOK | 5,876,913 |
| 42 | BSA LifeStructures | 5,789,413 |
| 43 | NTD Architecture | 5,586,000 |
| 44 | LMN Architects | 5,549,900 |
| 45 | Ratio Architects | 5,537,316 |
| 46 | Leo A Daly | 5,395,356 |
| 47 | Bergmann Associates | 5,304,175 |
| 48 | Little | 5,249,190 |
| 49 | Hammel, Green and Abrahamson | 4,836,088 |
| 50 | Legat Architects | 4,685,600 |
| 51 | GBBN Architects | 4,560,000 |
| 52 | Carrier Johnson + Culture | 4,060,468 |
| 53 | Parkhill, Smith & Cooper | 4,026,000 |
| 54 | Cooper Carry | 3,961,244 |
| 55 | CTA Architects Engineers | 3,737,320 |
| 56 | Cambridge Seven Associates | 3,473,000 |
| 57 | PGAL | 3,260,300 |
| 58 | BLDD Architects | 3,000,000 |
| 59 | IBI Group ? Gruzen Samton | 3,000,000 |
| 60 | Kohn Pedersen Fox Associates | 2,974,000 |
| 61 | Slaterpaull Architects | 2,879,532 |
| 62 | Hord Coplan Macht | 2,843,072 |
| 63 | OZ Architecture | 2,825,000 |
| 64 | Kirksey | 2,822,225 |
| 65 | Rule Joy Trammell + Rubio | 2,801,380 |
| 66 | WDG Architecture | 2,757,000 |
| 67 | RS&H | 2,450,000 |
| 68 | SchenkelShultz Architecture | 2,386,000 |
| 69 | Payette | 2,282,352 |
| 70 | Corgan | 2,202,280 |
| 71 | Integrus Architecture | 2,191,762 |
| 72 | BLTa | 2,175,000 |
| 73 | H3 Hardy Collaboration Architecture | 2,141,323 |
| 74 | WHR Architects | 1,958,367 |
| 75 | Baskervill | 1,853,208 |
| 76 | Ashley McGraw Architects | 1,836,510 |
| 77 | KZF Design | 1,698,300 |
| 78 | Eppstein Uhen Architects | 1,691,787 |
| 79 | VOA Associates | 1,628,847 |
| 80 | GWWO | 1,623,501 |
| 81 | Wight & Company | 1,586,000 |
| 82 | Hoffmann Architects | 1,548,000 |
| 83 | Symmes Maini & McKee Associates | 1,530,000 |
| 84 | PBK | 1,500,000 |
| 85 | NAC|Architecture | 1,424,431 |
| 86 | LaBella Associates | 1,310,186 |
| 87 | Niles Bolton Associates | 1,263,210 |
| 88 | Nelson | 1,213,987 |
| 89 | Fentress Architects | 1,120,400 |
| 90 | Urban Design Group | 1,100,000 |
| 91 | Environetics | 1,087,370 |
| 92 | NORR | 1,052,484 |
| 93 | Becker Morgan Group | 1,037,159 |
| 94 | Albert Kahn Associates | 904,065 |
| 95 | RTKL Associates | 849,000 |
| 96 | Good Fulton & Farrell | 815,800 |
| 97 | Goettsch Partners | 810,000 |
| 98 | BBS Architects | 800,240 |
| 99 | Commonwealth Architects | 775,074 |
| 100 | Francis Cauffman | 707,774 |
| 101 | RNL | 690,000 |
| 102 | RBB Architects | 657,149 |
| 103 | RSP Architects | 620,000 |
| 104 | Gresham, Smith and Partners | 567,000 |
| 105 | Fanning/Howey Associates | 541,000 |
| 106 | Rosser International | 539,460 |
| 107 | Harvard Jolly Architecture | 530,103 |
| 108 | DesignGroup | 457,970 |
| 109 | Hnedak Bobo Group | 353,000 |
| 110 | JRS Architect | 295,000 |
| 111 | Emersion Design | 273,766 |
| 112 | Ware Malcomb | 240,000 |
| 113 | H+L Architecture | 236,252 |
| 114 | Smallwood, Reynolds, Stewart, Stewart & Associates | 226,716 |
| 115 | Sherlock, Smith & Adams | 219,000 |
Top University Sector Engineering Firms
| Rank | Company | 2013 Higher Ed Revenue |
| 1 | AECOM Technology Corp. | $76,410,000 |
| 2 | Jacobs | 35,150,000 |
| 3 | URS Corp. | 29,434,668 |
| 4 | Vanderweil Engineers | 26,614,500 |
| 5 | Burns & McDonnell | 24,152,332 |
| 6 | Affiliated Engineers | 22,469,000 |
| 7 | Parsons Brinckerhoff | 20,057,993 |
| 8 | STV | 18,416,000 |
| 9 | Arup | 14,561,909 |
| 10 | KJWW Engineering Consultants | 13,071,767 |
| 11 | BR+A Consulting Engineers | 10,120,000 |
| 12 | WSP Group | 9,120,000 |
| 13 | Simpson Gumpertz & Heger | 9,070,000 |
| 14 | Thornton Tomasetti | 7,942,631 |
| 15 | M-E Engineers | 7,243,000 |
| 16 | P2S Engineering | 7,170,208 |
| 17 | Shive-Hattery | 6,612,598 |
| 18 | Wiss, Janney, Elstner Associates | 6,550,000 |
| 19 | Dewberry | 6,331,593 |
| 20 | Environmental Systems Design | 6,144,227 |
| 21 | RMF Engineering | 5,400,000 |
| 22 | AKF Group | 5,261,000 |
| 23 | Glumac | 4,922,565 |
| 24 | M/E Engineering | 4,699,367 |
| 25 | TTG | 4,600,100 |
| 26 | Newcomb & Boyd | 4,505,166 |
| 27 | RDK Engineers | 4,490,000 |
| 28 | Heapy Engineering | 4,426,631 |
| 29 | KCI Technologies | 4,400,000 |
| 30 | Interface Engineering | 4,351,590 |
| 31 | Joseph R. Loring & Associates | 4,100,000 |
| 32 | I. C. Thomasson Associates | 3,500,000 |
| 33 | Spectrum Engineers | 3,347,542 |
| 34 | Highland Associates | 3,200,000 |
| 35 | KPFF Consulting Engineers | 3,125,000 |
| 36 | Syska Hennessy Group | 3,072,512 |
| 37 | Ross & Baruzzini | 3,043,445 |
| 38 | H.F. Lenz | 2,878,115 |
| 39 | Rist-Frost-Shumway Engineering | 2,850,000 |
| 40 | Sparling | 2,553,080 |
| 41 | Smith Seckman Reid | 2,519,005 |
| 42 | Martin/Martin | 2,263,812 |
| 43 | Karpinski Engineering | 2,170,197 |
| 44 | Aon Fire Protection Engineering Corp. | 2,000,000 |
| 45 | Fishbeck, Thompson, Carr & Huber | 2,000,000 |
| 46 | SSOE Group | 1,912,012 |
| 47 | Henderson Engineers | 1,838,909 |
| 48 | TLC Engineering for Architecture | 1,806,782 |
| 49 | Zak Companies | 1,706,697 |
| 50 | Bridgers & Paxton Consulting Engineers | 1,686,953 |
| 51 | CJL Engineering | 1,657,350 |
| 52 | Graef | 1,584,321 |
| 53 | Primera Engineers | 1,456,000 |
| 54 | CCRD Partners | 1,388,000 |
| 55 | Brinjac Engineering | 1,303,855 |
| 56 | Paulus, Sokolowski and Sartor | 1,200,000 |
| 57 | Wallace Engineering | 1,133,000 |
| 58 | Stanley Consultants | 1,090,529 |
| 59 | Leidos | 1,040,000 |
| 60 | Walter P Moore and Associates | 1,005,161 |
| 61 | Allen & Shariff | 1,000,000 |
| 62 | Dunham Associates | 950,000 |
| 63 | Bala Consulting Engineers | 926,000 |
| 64 | Degenkolb Engineers | 855,093 |
| 65 | OLA Consulting Engineers | 840,000 |
| 66 | Mazzetti | 774,981 |
| 67 | DeSimone Consulting Engineers | 474,096 |
| 68 | KLH Engineers | 468,745 |
| 69 | ThermalTech Engineering | 460,000 |
| 70 | French & Parrello Associates | 300,690 |
| 71 | GHT Limited | 260,000 |
| 72 | Wick Fisher White | 223,276 |
| 73 | CTLGroup | 220,000 |
| 74 | Davis, Bowen & Friedel | 204,422 |
| 75 | Barge Waggoner Sumner & Cannon | 200,000 |
| 76 | Magnusson Klemencic Associates | 166,730 |
| 77 | Coffman Engineers | 116,263 |
Top University Sector Construction Firms
| Rank | Company | 2013 Higher Ed Revenue |
| 1 | Whiting-Turner Contracting Co., The | $818,698,552 |
| 2 | Turner Construction | 774,984,000 |
| 3 | Gilbane | 475,524,757 |
| 4 | Skanska USA | 371,024,162 |
| 5 | PCL Construction | 368,990,947 |
| 6 | Clark Group | 312,942,079 |
| 7 | Shawmut Design and Construction | 265,610,000 |
| 8 | Barton Malow | 264,908,516 |
| 9 | Structure Tone | 229,539,000 |
| 10 | Consigli Construction | 227,995,719 |
| 11 | Mortenson Construction | 220,320,000 |
| 12 | McCarthy Holdings | 203,600,000 |
| 13 | Sundt Construction | 185,867,366 |
| 14 | Holder Construction | 176,219,000 |
| 15 | Messer Construction | 172,997,147 |
| 16 | Balfour Beatty US | 171,519,250 |
| 17 | JE Dunn Construction | 164,791,311 |
| 18 | LeChase Construction Services | 164,000,000 |
| 19 | Walbridge | 163,500,000 |
| 20 | Power Construction | 159,000,000 |
| 21 | Beck Group, The | 157,055,739 |
| 22 | Suffolk Construction | 149,745,824 |
| 23 | Tutor Perini Corp. | 145,671,900 |
| 24 | DPR Construction | 140,724,634 |
| 25 | W. M. Jordan Company | 130,566,823 |
| 26 | C.W. Driver | 127,735,000 |
| 27 | Flintco | 113,500,000 |
| 28 | Walsh Group, The | 111,960,180 |
| 29 | Boldt Company, The | 107,802,444 |
| 30 | Brasfield & Gorrie | 107,242,213 |
| 31 | Juneau Construction | 97,432,186 |
| 32 | Manhattan Construction | 89,176,000 |
| 33 | Rodgers Builders | 88,744,572 |
| 34 | McGough | 82,000,000 |
| 35 | Summit Contracting Group | 80,286,141 |
| 36 | Choate Construction | 77,541,745 |
| 37 | Pepper Construction | 72,000,000 |
| 38 | Hathaway Dinwiddie Construction | 66,219,000 |
| 39 | Bernards | 66,000,000 |
| 40 | Hensel Phelps | 65,670,000 |
| 41 | O'Neil Industries/W.E. O'Neil | 65,552,134 |
| 42 | Kraus-Anderson Construction | 64,000,000 |
| 43 | Hunt Construction Group | 64,000,000 |
| 44 | B. L. Harbert International | 63,854,476 |
| 45 | Lend Lease | 56,720,000 |
| 46 | CORE Construction Group | 55,821,501 |
| 47 | Fortis Construction | 53,628,000 |
| 48 | Layton Construction | 52,600,000 |
| 49 | Paric Corp. | 50,000,000 |
| 50 | New South Construction | 47,702,000 |
| 51 | Hill & Wilkinson | 46,288,000 |
| 52 | Austin Commercial | 44,335,793 |
| 53 | Yates Companies, The | 42,800,000 |
| 54 | Bette Companies, The | 38,929,000 |
| 55 | Hoffman Construction | 37,000,000 |
| 56 | Coakley & Williams Construction | 32,064,969 |
| 57 | Adolfson & Peterson Construction | 30,713,572 |
| 58 | URS Corp. | 29,434,668 |
| 59 | James G. Davis Construction | 27,506,326 |
| 60 | Weitz Company, The | 26,478,980 |
| 61 | Bomel Construction | 24,949,344 |
| 62 | Linbeck Group | 24,410,000 |
| 63 | LPCiminelli | 23,426,935 |
| 64 | IMC Construction | 22,086,310 |
| 65 | Hill International | 22,000,000 |
| 66 | HITT Contracting | 20,900,000 |
| 67 | E.W. Howell | 20,566,000 |
| 68 | Parsons Brinckerhoff | 20,057,993 |
| 69 | STV | 18,416,000 |
| 70 | Stalco Construction | 17,780,000 |
| 71 | Haselden Construction | 17,425,677 |
| 72 | Kitchell Corp. | 13,043,551 |
| 73 | Hoar Construction | 12,920,000 |
| 74 | Batson-Cook | 12,513,549 |
| 75 | Absher Construction | 12,280,813 |
| 76 | S. M. Wilson & Co. | 10,863,488 |
| 77 | James McHugh Construction | 10,538,534 |
| 78 | Robins & Morton | 8,714,264 |
| 79 | Clune Construction | 8,635,947 |
| 80 | Haskell | 8,294,931 |
| 81 | Alberici Constructors | 7,380,631 |
| 82 | Heery International | 7,186,274 |
| 83 | Wight & Company | 4,935,000 |
| 84 | Gray Construction | 3,880,000 |
| 85 | Ryan Companies US | 3,715,948 |
| 86 | KBE Building Corp. | 2,694,826 |
| 87 | Leopardo Companies | 1,907,266 |
| 88 | Douglas Company, The | 1,507,502 |
| 89 | JLL | 1,375,045 |
| 90 | Astorino | 1,222,033 |
| 91 | Allen & Shariff | 1,000,000 |
Read BD+C's full 2014 Giants 300 Report
Related Stories

| Jan 10, 2011
Architect Jean Nouvel designs an island near Paris
Abandoned by carmaker Renault almost 20 years ago, Seguin Island in Boulogne-Billancourt, France, is being renewed by architect Jean Nouvel. Plans for the 300,000-square-meter project includes a mix of culture, commerce, urban parks, and gardens, which officials hope will attract both Parisians and tourists.

| Jan 10, 2011
Michael J. Alter, president of The Alter Group: ‘There’s a significant pent-up demand for projects’
Michael J. Alter, president of The Alter Group, a national corporate real estate development firm headquartered in Skokie, Ill., on the growth of urban centers, project financing, and what clients are saying about sustainability.
| Jan 7, 2011
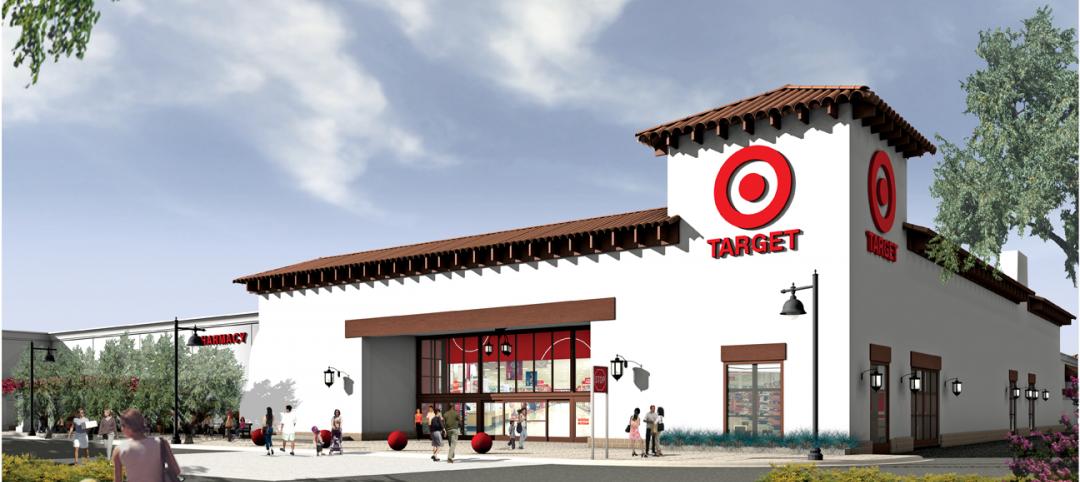
BIM on Target
By using BIM for the design of its new San Clemente, Calif., store, big-box retailer Target has been able to model the entire structural steel package, including joists, in 3D, chopping the timeline for shop drawings from as much as 10 weeks down to an ‘unheard of’ three-and-a-half weeks.
| Jan 7, 2011
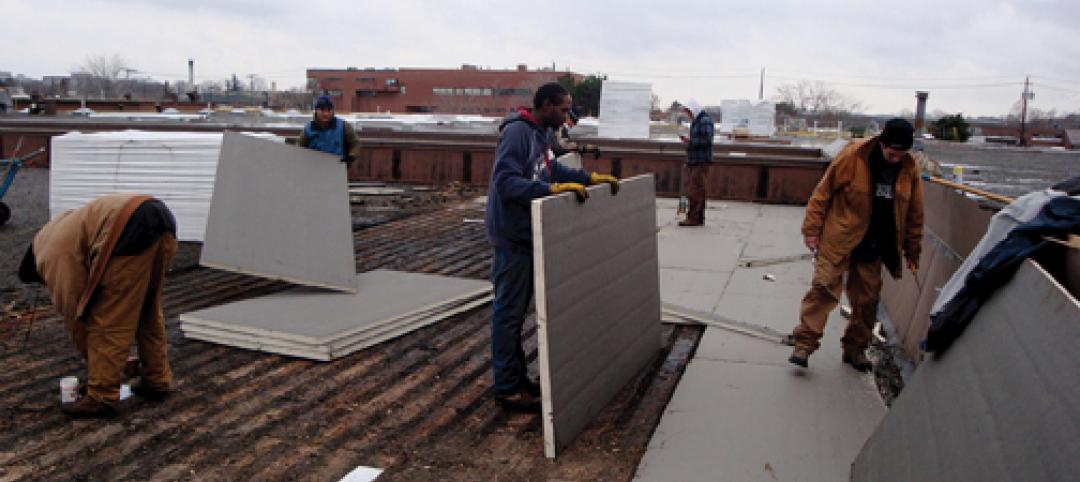
How Building Teams Choose Roofing Systems
A roofing survey emailed to a representative sample of BD+C’s subscriber list revealed such key findings as: Respondents named metal (56%) and EPDM (50%) as the roofing systems they (or their firms) employed most in projects. Also, new construction and retrofits were fairly evenly split among respondents’ roofing-related projects over the last couple of years.

| Jan 7, 2011
Total construction to rise 5.1% in 2011
Total U.S. construction spending will increase 5.1% in 2011. The gain from the end of 2010 to the end of 2011 will be 10%. The biggest annual gain in 2011 will be 10% for new residential construction, far above the 2-3% gains in all other construction sectors.
| Jan 7, 2011
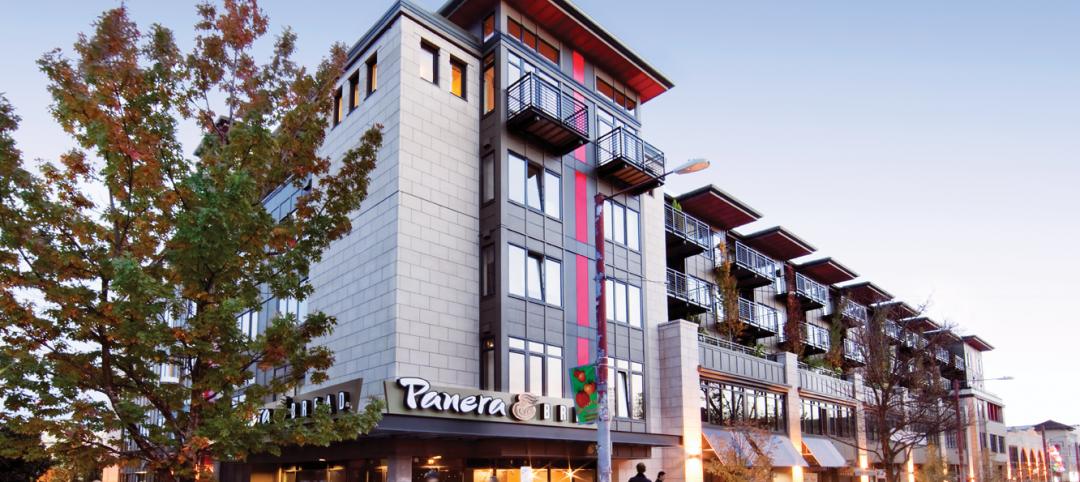
Mixed-Use on Steroids
Mixed-use development has been one of the few bright spots in real estate in the last few years. Successful mixed-use projects are almost always located in dense urban or suburban areas, usually close to public transportation. It’s a sign of the times that the residential component tends to be rental rather than for-sale.
| Jan 4, 2011
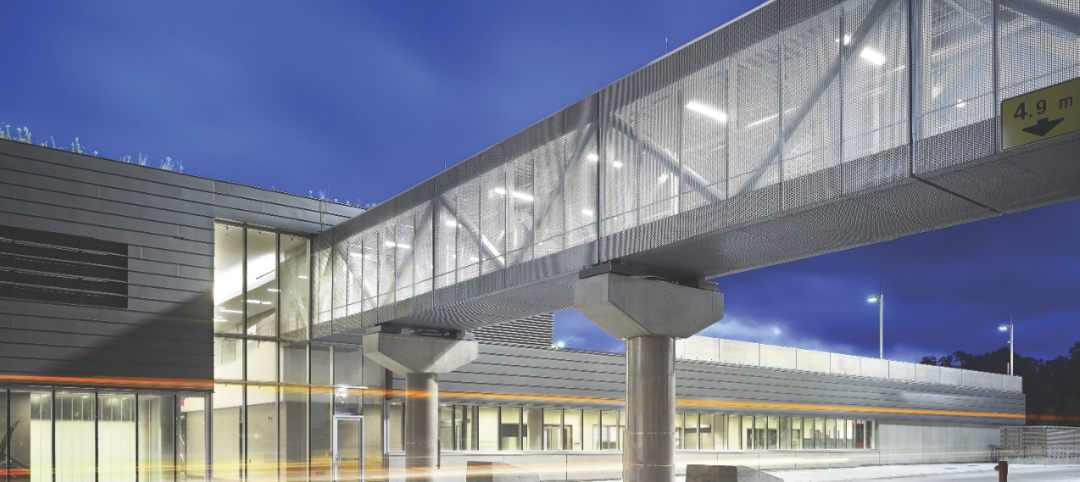
Product of the Week: Zinc cladding helps border crossing blend in with surroundings
Zinc panels provide natural-looking, durable cladding for an administrative building and toll canopies at the newly expanded Queenstown Plaza U.S.-Canada border crossing at the Niagara Gorge. Toronto’s Moriyama & Teshima Architects chose the zinc alloy panels for their ability to blend with the structures’ scenic surroundings, as well as for their low maintenance and sustainable qualities. The structures incorporate 14,000 sf of Rheinzink’s branded Angled Standing Seam and Reveal Panels in graphite gray.
| Jan 4, 2011
6 green building trends to watch in 2011
According to a report by New York-based JWT Intelligence, there are six key green building trends to watch in 2011, including: 3D printing, biomimicry, and more transparent and accurate green claims.


