


An analysis of Dun & Bradstreet stats by consultant Paul Abramson indicates that some $11 billion was spent on higher ed construction last year—up a billion from 2012, with nearly 70% comprising new buildings (http://bit.ly/1qhMzaw).
As examined in BD+C’s in-depth May report, university stakeholders face complicated cap-ex stressors, from chronic (lender stinginess, deferred maintenance) to impending (President Obama’s pledge to start rating colleges on value delivered, consumer pushback on ever-rising costs).
Creative approaches to financing, design, and delivery are top-of-mind. Paula Stamp, Business Development Manager in the Los Angeles office of PCL Construction, says clients are exploring CM at risk, design-build, and design risk. Margie Simmons, VP and Education Sector Leader at Stantec, adds: “Higher debt levels will encourage institutions to seek off-balance-sheet financing solutions and P3s.”
Teri Jones, VP at Sundt Construction, sees a similar pattern, plus emphasis on revenue-generating buildings like dorms and recreation centers.
Facility trends observed by Stamp include housing construction by community colleges (serving a growing international-student population) and better use of indoor and outdoor circulation and common space. John Baxter, Education Sector Leader at EYP, says clients are asking for features that enhance an interactive “corridor culture” in dorms.
Michael Medici, AIA, NCARB, Learning Practice Leader and Senior VP at SmithGroupJJR, mentions growing demand for facilities that support interprofessional health sciences education and project-based, career-oriented learning. Also gaining traction: office zones that mimic private-sector workplaces, with less assigned space and more team zones.
Perkins+Will higher ed designers Jeff Ziebarth, Jeff Stebar, and John Long are also seeing this pattern; Long says younger faculty and administrators have been a lot more receptive than veterans.
Top University Sector Architecture Firms
| Rank | Company | 2013 Higher Ed Revenue |
| 1 | CannonDesign | $76,000,000 |
| 2 | Perkins+will | 45,582,532 |
| 3 | Stantec | 42,368,888 |
| 4 | EYP Architecture & Engineering | 39,000,000 |
| 5 | Gensler | 29,492,000 |
| 6 | SmithGroupJJR | 27,088,190 |
| 7 | Clark Nexsen | 21,732,694 |
| 8 | Skidmore, Owings & Merrill | 20,933,579 |
| 9 | Page | 19,771,000 |
| 10 | ZGF Architects | 19,397,489 |
| 11 | Wilson Architects | 18,500,000 |
| 12 | Ennead Architects | 18,086,505 |
| 13 | Flad Architects | 16,260,000 |
| 14 | SHW Group | 15,991,000 |
| 15 | Shepley Bulfinch | 15,595,000 |
| 16 | Harley Ellis Devereaux | 15,120,000 |
| 17 | Moseley Architects | 15,016,516 |
| 18 | Lord Aeck Sargent | 13,533,882 |
| 19 | HMC Architects | 13,440,933 |
| 20 | NBBJ | 13,242,000 |
| 21 | HKS | 12,847,559 |
| 22 | Ballinger | 12,113,215 |
| 23 | Beyer Blinder Belle | 11,627,926 |
| 24 | DLR Group | 11,100,000 |
| 25 | LS3P | 10,532,964 |
| 26 | Morris Architects | 10,000,000 |
| 27 | Solomon Cordwell Buenz | 10,000,000 |
| 28 | Davis Brody Bond | 9,835,655 |
| 29 | FGM Architects | 9,821,820 |
| 30 | LPA | 9,561,760 |
| 31 | Perkins Eastman | 9,300,000 |
| 32 | Moody Nolan | 9,104,965 |
| 33 | CO Architects | 8,912,400 |
| 34 | EwingCole | 7,430,000 |
| 35 | Heery International | 7,186,274 |
| 36 | Hastings+Chivetta Architects | 6,378,602 |
| 37 | Westlake Reed Leskosky | 6,325,000 |
| 38 | FXFOWLE Architects | 6,200,000 |
| 39 | Mithun | 6,158,000 |
| 40 | Goodwyn Mills & Cawood | 6,127,329 |
| 41 | HOK | 5,876,913 |
| 42 | BSA LifeStructures | 5,789,413 |
| 43 | NTD Architecture | 5,586,000 |
| 44 | LMN Architects | 5,549,900 |
| 45 | Ratio Architects | 5,537,316 |
| 46 | Leo A Daly | 5,395,356 |
| 47 | Bergmann Associates | 5,304,175 |
| 48 | Little | 5,249,190 |
| 49 | Hammel, Green and Abrahamson | 4,836,088 |
| 50 | Legat Architects | 4,685,600 |
| 51 | GBBN Architects | 4,560,000 |
| 52 | Carrier Johnson + Culture | 4,060,468 |
| 53 | Parkhill, Smith & Cooper | 4,026,000 |
| 54 | Cooper Carry | 3,961,244 |
| 55 | CTA Architects Engineers | 3,737,320 |
| 56 | Cambridge Seven Associates | 3,473,000 |
| 57 | PGAL | 3,260,300 |
| 58 | BLDD Architects | 3,000,000 |
| 59 | IBI Group ? Gruzen Samton | 3,000,000 |
| 60 | Kohn Pedersen Fox Associates | 2,974,000 |
| 61 | Slaterpaull Architects | 2,879,532 |
| 62 | Hord Coplan Macht | 2,843,072 |
| 63 | OZ Architecture | 2,825,000 |
| 64 | Kirksey | 2,822,225 |
| 65 | Rule Joy Trammell + Rubio | 2,801,380 |
| 66 | WDG Architecture | 2,757,000 |
| 67 | RS&H | 2,450,000 |
| 68 | SchenkelShultz Architecture | 2,386,000 |
| 69 | Payette | 2,282,352 |
| 70 | Corgan | 2,202,280 |
| 71 | Integrus Architecture | 2,191,762 |
| 72 | BLTa | 2,175,000 |
| 73 | H3 Hardy Collaboration Architecture | 2,141,323 |
| 74 | WHR Architects | 1,958,367 |
| 75 | Baskervill | 1,853,208 |
| 76 | Ashley McGraw Architects | 1,836,510 |
| 77 | KZF Design | 1,698,300 |
| 78 | Eppstein Uhen Architects | 1,691,787 |
| 79 | VOA Associates | 1,628,847 |
| 80 | GWWO | 1,623,501 |
| 81 | Wight & Company | 1,586,000 |
| 82 | Hoffmann Architects | 1,548,000 |
| 83 | Symmes Maini & McKee Associates | 1,530,000 |
| 84 | PBK | 1,500,000 |
| 85 | NAC|Architecture | 1,424,431 |
| 86 | LaBella Associates | 1,310,186 |
| 87 | Niles Bolton Associates | 1,263,210 |
| 88 | Nelson | 1,213,987 |
| 89 | Fentress Architects | 1,120,400 |
| 90 | Urban Design Group | 1,100,000 |
| 91 | Environetics | 1,087,370 |
| 92 | NORR | 1,052,484 |
| 93 | Becker Morgan Group | 1,037,159 |
| 94 | Albert Kahn Associates | 904,065 |
| 95 | RTKL Associates | 849,000 |
| 96 | Good Fulton & Farrell | 815,800 |
| 97 | Goettsch Partners | 810,000 |
| 98 | BBS Architects | 800,240 |
| 99 | Commonwealth Architects | 775,074 |
| 100 | Francis Cauffman | 707,774 |
| 101 | RNL | 690,000 |
| 102 | RBB Architects | 657,149 |
| 103 | RSP Architects | 620,000 |
| 104 | Gresham, Smith and Partners | 567,000 |
| 105 | Fanning/Howey Associates | 541,000 |
| 106 | Rosser International | 539,460 |
| 107 | Harvard Jolly Architecture | 530,103 |
| 108 | DesignGroup | 457,970 |
| 109 | Hnedak Bobo Group | 353,000 |
| 110 | JRS Architect | 295,000 |
| 111 | Emersion Design | 273,766 |
| 112 | Ware Malcomb | 240,000 |
| 113 | H+L Architecture | 236,252 |
| 114 | Smallwood, Reynolds, Stewart, Stewart & Associates | 226,716 |
| 115 | Sherlock, Smith & Adams | 219,000 |
Top University Sector Engineering Firms
| Rank | Company | 2013 Higher Ed Revenue |
| 1 | AECOM Technology Corp. | $76,410,000 |
| 2 | Jacobs | 35,150,000 |
| 3 | URS Corp. | 29,434,668 |
| 4 | Vanderweil Engineers | 26,614,500 |
| 5 | Burns & McDonnell | 24,152,332 |
| 6 | Affiliated Engineers | 22,469,000 |
| 7 | Parsons Brinckerhoff | 20,057,993 |
| 8 | STV | 18,416,000 |
| 9 | Arup | 14,561,909 |
| 10 | KJWW Engineering Consultants | 13,071,767 |
| 11 | BR+A Consulting Engineers | 10,120,000 |
| 12 | WSP Group | 9,120,000 |
| 13 | Simpson Gumpertz & Heger | 9,070,000 |
| 14 | Thornton Tomasetti | 7,942,631 |
| 15 | M-E Engineers | 7,243,000 |
| 16 | P2S Engineering | 7,170,208 |
| 17 | Shive-Hattery | 6,612,598 |
| 18 | Wiss, Janney, Elstner Associates | 6,550,000 |
| 19 | Dewberry | 6,331,593 |
| 20 | Environmental Systems Design | 6,144,227 |
| 21 | RMF Engineering | 5,400,000 |
| 22 | AKF Group | 5,261,000 |
| 23 | Glumac | 4,922,565 |
| 24 | M/E Engineering | 4,699,367 |
| 25 | TTG | 4,600,100 |
| 26 | Newcomb & Boyd | 4,505,166 |
| 27 | RDK Engineers | 4,490,000 |
| 28 | Heapy Engineering | 4,426,631 |
| 29 | KCI Technologies | 4,400,000 |
| 30 | Interface Engineering | 4,351,590 |
| 31 | Joseph R. Loring & Associates | 4,100,000 |
| 32 | I. C. Thomasson Associates | 3,500,000 |
| 33 | Spectrum Engineers | 3,347,542 |
| 34 | Highland Associates | 3,200,000 |
| 35 | KPFF Consulting Engineers | 3,125,000 |
| 36 | Syska Hennessy Group | 3,072,512 |
| 37 | Ross & Baruzzini | 3,043,445 |
| 38 | H.F. Lenz | 2,878,115 |
| 39 | Rist-Frost-Shumway Engineering | 2,850,000 |
| 40 | Sparling | 2,553,080 |
| 41 | Smith Seckman Reid | 2,519,005 |
| 42 | Martin/Martin | 2,263,812 |
| 43 | Karpinski Engineering | 2,170,197 |
| 44 | Aon Fire Protection Engineering Corp. | 2,000,000 |
| 45 | Fishbeck, Thompson, Carr & Huber | 2,000,000 |
| 46 | SSOE Group | 1,912,012 |
| 47 | Henderson Engineers | 1,838,909 |
| 48 | TLC Engineering for Architecture | 1,806,782 |
| 49 | Zak Companies | 1,706,697 |
| 50 | Bridgers & Paxton Consulting Engineers | 1,686,953 |
| 51 | CJL Engineering | 1,657,350 |
| 52 | Graef | 1,584,321 |
| 53 | Primera Engineers | 1,456,000 |
| 54 | CCRD Partners | 1,388,000 |
| 55 | Brinjac Engineering | 1,303,855 |
| 56 | Paulus, Sokolowski and Sartor | 1,200,000 |
| 57 | Wallace Engineering | 1,133,000 |
| 58 | Stanley Consultants | 1,090,529 |
| 59 | Leidos | 1,040,000 |
| 60 | Walter P Moore and Associates | 1,005,161 |
| 61 | Allen & Shariff | 1,000,000 |
| 62 | Dunham Associates | 950,000 |
| 63 | Bala Consulting Engineers | 926,000 |
| 64 | Degenkolb Engineers | 855,093 |
| 65 | OLA Consulting Engineers | 840,000 |
| 66 | Mazzetti | 774,981 |
| 67 | DeSimone Consulting Engineers | 474,096 |
| 68 | KLH Engineers | 468,745 |
| 69 | ThermalTech Engineering | 460,000 |
| 70 | French & Parrello Associates | 300,690 |
| 71 | GHT Limited | 260,000 |
| 72 | Wick Fisher White | 223,276 |
| 73 | CTLGroup | 220,000 |
| 74 | Davis, Bowen & Friedel | 204,422 |
| 75 | Barge Waggoner Sumner & Cannon | 200,000 |
| 76 | Magnusson Klemencic Associates | 166,730 |
| 77 | Coffman Engineers | 116,263 |
Top University Sector Construction Firms
| Rank | Company | 2013 Higher Ed Revenue |
| 1 | Whiting-Turner Contracting Co., The | $818,698,552 |
| 2 | Turner Construction | 774,984,000 |
| 3 | Gilbane | 475,524,757 |
| 4 | Skanska USA | 371,024,162 |
| 5 | PCL Construction | 368,990,947 |
| 6 | Clark Group | 312,942,079 |
| 7 | Shawmut Design and Construction | 265,610,000 |
| 8 | Barton Malow | 264,908,516 |
| 9 | Structure Tone | 229,539,000 |
| 10 | Consigli Construction | 227,995,719 |
| 11 | Mortenson Construction | 220,320,000 |
| 12 | McCarthy Holdings | 203,600,000 |
| 13 | Sundt Construction | 185,867,366 |
| 14 | Holder Construction | 176,219,000 |
| 15 | Messer Construction | 172,997,147 |
| 16 | Balfour Beatty US | 171,519,250 |
| 17 | JE Dunn Construction | 164,791,311 |
| 18 | LeChase Construction Services | 164,000,000 |
| 19 | Walbridge | 163,500,000 |
| 20 | Power Construction | 159,000,000 |
| 21 | Beck Group, The | 157,055,739 |
| 22 | Suffolk Construction | 149,745,824 |
| 23 | Tutor Perini Corp. | 145,671,900 |
| 24 | DPR Construction | 140,724,634 |
| 25 | W. M. Jordan Company | 130,566,823 |
| 26 | C.W. Driver | 127,735,000 |
| 27 | Flintco | 113,500,000 |
| 28 | Walsh Group, The | 111,960,180 |
| 29 | Boldt Company, The | 107,802,444 |
| 30 | Brasfield & Gorrie | 107,242,213 |
| 31 | Juneau Construction | 97,432,186 |
| 32 | Manhattan Construction | 89,176,000 |
| 33 | Rodgers Builders | 88,744,572 |
| 34 | McGough | 82,000,000 |
| 35 | Summit Contracting Group | 80,286,141 |
| 36 | Choate Construction | 77,541,745 |
| 37 | Pepper Construction | 72,000,000 |
| 38 | Hathaway Dinwiddie Construction | 66,219,000 |
| 39 | Bernards | 66,000,000 |
| 40 | Hensel Phelps | 65,670,000 |
| 41 | O'Neil Industries/W.E. O'Neil | 65,552,134 |
| 42 | Kraus-Anderson Construction | 64,000,000 |
| 43 | Hunt Construction Group | 64,000,000 |
| 44 | B. L. Harbert International | 63,854,476 |
| 45 | Lend Lease | 56,720,000 |
| 46 | CORE Construction Group | 55,821,501 |
| 47 | Fortis Construction | 53,628,000 |
| 48 | Layton Construction | 52,600,000 |
| 49 | Paric Corp. | 50,000,000 |
| 50 | New South Construction | 47,702,000 |
| 51 | Hill & Wilkinson | 46,288,000 |
| 52 | Austin Commercial | 44,335,793 |
| 53 | Yates Companies, The | 42,800,000 |
| 54 | Bette Companies, The | 38,929,000 |
| 55 | Hoffman Construction | 37,000,000 |
| 56 | Coakley & Williams Construction | 32,064,969 |
| 57 | Adolfson & Peterson Construction | 30,713,572 |
| 58 | URS Corp. | 29,434,668 |
| 59 | James G. Davis Construction | 27,506,326 |
| 60 | Weitz Company, The | 26,478,980 |
| 61 | Bomel Construction | 24,949,344 |
| 62 | Linbeck Group | 24,410,000 |
| 63 | LPCiminelli | 23,426,935 |
| 64 | IMC Construction | 22,086,310 |
| 65 | Hill International | 22,000,000 |
| 66 | HITT Contracting | 20,900,000 |
| 67 | E.W. Howell | 20,566,000 |
| 68 | Parsons Brinckerhoff | 20,057,993 |
| 69 | STV | 18,416,000 |
| 70 | Stalco Construction | 17,780,000 |
| 71 | Haselden Construction | 17,425,677 |
| 72 | Kitchell Corp. | 13,043,551 |
| 73 | Hoar Construction | 12,920,000 |
| 74 | Batson-Cook | 12,513,549 |
| 75 | Absher Construction | 12,280,813 |
| 76 | S. M. Wilson & Co. | 10,863,488 |
| 77 | James McHugh Construction | 10,538,534 |
| 78 | Robins & Morton | 8,714,264 |
| 79 | Clune Construction | 8,635,947 |
| 80 | Haskell | 8,294,931 |
| 81 | Alberici Constructors | 7,380,631 |
| 82 | Heery International | 7,186,274 |
| 83 | Wight & Company | 4,935,000 |
| 84 | Gray Construction | 3,880,000 |
| 85 | Ryan Companies US | 3,715,948 |
| 86 | KBE Building Corp. | 2,694,826 |
| 87 | Leopardo Companies | 1,907,266 |
| 88 | Douglas Company, The | 1,507,502 |
| 89 | JLL | 1,375,045 |
| 90 | Astorino | 1,222,033 |
| 91 | Allen & Shariff | 1,000,000 |
Read BD+C's full 2014 Giants 300 Report
Related Stories

| Jan 13, 2014
Custom exterior fabricator A. Zahner unveils free façade design software for architects
The web-based tool uses the company's factory floor like "a massive rapid prototype machine,” allowing designers to manipulate designs on the fly based on cost and other factors, according to CEO/President Bill Zahner.

| Jan 13, 2014
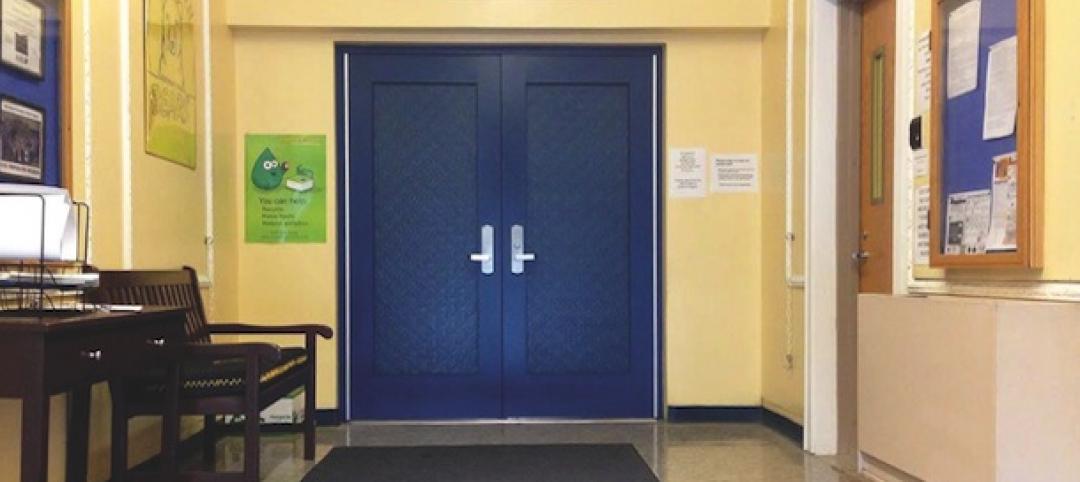
AEC professionals weigh in on school security
An exclusive survey reveals that Building Teams are doing their part to make the nation’s schools safer in the aftermath of the Sandy Hook tragedy.

| Jan 13, 2014
6 legislative actions to ignite the construction economy
The American Institute of Architects announced its “punch list” for Congress that, if completed, will ignite the construction economy by spurring much needed improvements in energy efficiency, infrastructure, and resiliency, and create jobs for small business.

| Jan 12, 2014
CES showcases innovations: Can any of these help you do your job better?
The Consumer Electronics Show took place this past week in Las Vegas. Known for launching new products and technologies, many of the products showcased there set the bar for future innovators. The show also signals trends to watch in technology applicable to the design and building industry.

| Jan 12, 2014
The ‘fuzz factor’ in engineering: when continuous improvement is neither
The biggest threat to human life in a building isn’t the potential of natural disasters, but the threat of human error. I believe it’s a reality that increases in probability every time a code or standard change is proposed.
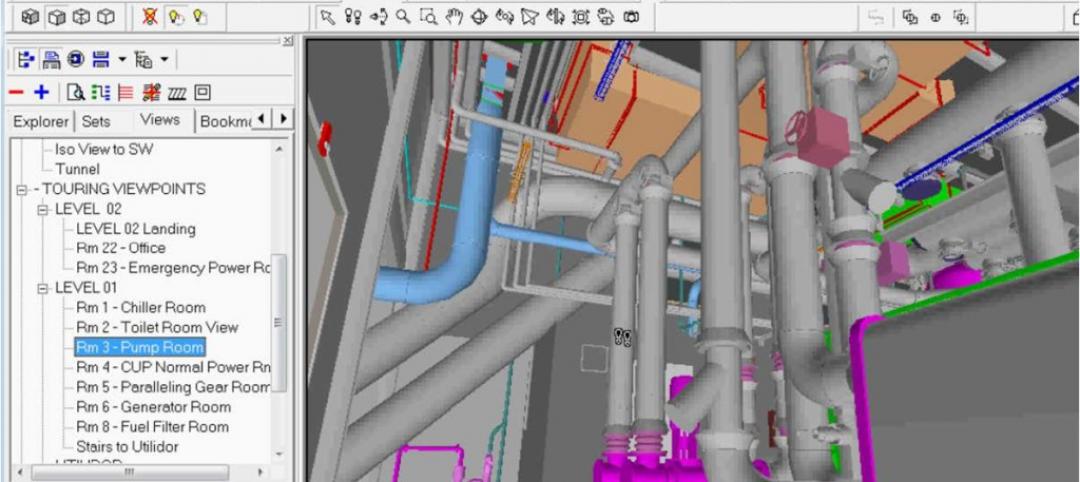
| Jan 12, 2014
5 ways virtual modeling can improve facilities management
Improved space management, streamlined maintenance, and economical retrofits are among the ways building owners and facility managers can benefit from building information modeling.

| Jan 11, 2014
Getting to net-zero energy with brick masonry construction [AIA course]
When targeting net-zero energy performance, AEC professionals are advised to tackle energy demand first. This AIA course covers brick masonry's role in reducing energy consumption in buildings.
| Jan 10, 2014
What the states should do to prevent more school shootings
To tell the truth, I didn’t want to write about the terrible events of December 14, 2012, when 20 children and six adults were gunned down at Sandy Hook Elementary School in Newtown, Conn. I figured other media would provide ample coverage, and anything we did would look cheap or inappropriate. But two things turned me around.

| Jan 10, 2014
Special Report: K-12 school security in the wake of Sandy Hook
BD+C's exclusive five-part report on K-12 school security offers proven design advice, technology recommendations, and thoughtful commentary on how Building Teams can help school districts prevent, or at least mitigate, a Sandy Hook on their turf.
| Jan 10, 2014
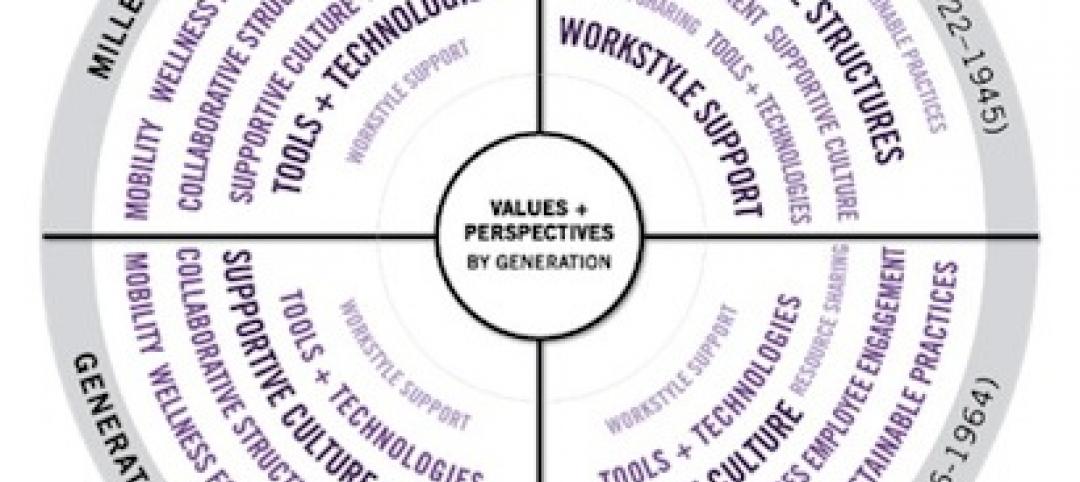
Resiliency, material health among top AEC focuses for 2014: Perkins+Will survey
Architectural giant Perkins+Will recently surveyed its staff of 1,500 design pros to forcast hot trends in the AEC field for 2014. The resulting Design + Insights Survey reflects a global perspective.


