


An analysis of Dun & Bradstreet stats by consultant Paul Abramson indicates that some $11 billion was spent on higher ed construction last year—up a billion from 2012, with nearly 70% comprising new buildings (http://bit.ly/1qhMzaw).
As examined in BD+C’s in-depth May report, university stakeholders face complicated cap-ex stressors, from chronic (lender stinginess, deferred maintenance) to impending (President Obama’s pledge to start rating colleges on value delivered, consumer pushback on ever-rising costs).
Creative approaches to financing, design, and delivery are top-of-mind. Paula Stamp, Business Development Manager in the Los Angeles office of PCL Construction, says clients are exploring CM at risk, design-build, and design risk. Margie Simmons, VP and Education Sector Leader at Stantec, adds: “Higher debt levels will encourage institutions to seek off-balance-sheet financing solutions and P3s.”
Teri Jones, VP at Sundt Construction, sees a similar pattern, plus emphasis on revenue-generating buildings like dorms and recreation centers.
Facility trends observed by Stamp include housing construction by community colleges (serving a growing international-student population) and better use of indoor and outdoor circulation and common space. John Baxter, Education Sector Leader at EYP, says clients are asking for features that enhance an interactive “corridor culture” in dorms.
Michael Medici, AIA, NCARB, Learning Practice Leader and Senior VP at SmithGroupJJR, mentions growing demand for facilities that support interprofessional health sciences education and project-based, career-oriented learning. Also gaining traction: office zones that mimic private-sector workplaces, with less assigned space and more team zones.
Perkins+Will higher ed designers Jeff Ziebarth, Jeff Stebar, and John Long are also seeing this pattern; Long says younger faculty and administrators have been a lot more receptive than veterans.
Top University Sector Architecture Firms
| Rank | Company | 2013 Higher Ed Revenue |
| 1 | CannonDesign | $76,000,000 |
| 2 | Perkins+will | 45,582,532 |
| 3 | Stantec | 42,368,888 |
| 4 | EYP Architecture & Engineering | 39,000,000 |
| 5 | Gensler | 29,492,000 |
| 6 | SmithGroupJJR | 27,088,190 |
| 7 | Clark Nexsen | 21,732,694 |
| 8 | Skidmore, Owings & Merrill | 20,933,579 |
| 9 | Page | 19,771,000 |
| 10 | ZGF Architects | 19,397,489 |
| 11 | Wilson Architects | 18,500,000 |
| 12 | Ennead Architects | 18,086,505 |
| 13 | Flad Architects | 16,260,000 |
| 14 | SHW Group | 15,991,000 |
| 15 | Shepley Bulfinch | 15,595,000 |
| 16 | Harley Ellis Devereaux | 15,120,000 |
| 17 | Moseley Architects | 15,016,516 |
| 18 | Lord Aeck Sargent | 13,533,882 |
| 19 | HMC Architects | 13,440,933 |
| 20 | NBBJ | 13,242,000 |
| 21 | HKS | 12,847,559 |
| 22 | Ballinger | 12,113,215 |
| 23 | Beyer Blinder Belle | 11,627,926 |
| 24 | DLR Group | 11,100,000 |
| 25 | LS3P | 10,532,964 |
| 26 | Morris Architects | 10,000,000 |
| 27 | Solomon Cordwell Buenz | 10,000,000 |
| 28 | Davis Brody Bond | 9,835,655 |
| 29 | FGM Architects | 9,821,820 |
| 30 | LPA | 9,561,760 |
| 31 | Perkins Eastman | 9,300,000 |
| 32 | Moody Nolan | 9,104,965 |
| 33 | CO Architects | 8,912,400 |
| 34 | EwingCole | 7,430,000 |
| 35 | Heery International | 7,186,274 |
| 36 | Hastings+Chivetta Architects | 6,378,602 |
| 37 | Westlake Reed Leskosky | 6,325,000 |
| 38 | FXFOWLE Architects | 6,200,000 |
| 39 | Mithun | 6,158,000 |
| 40 | Goodwyn Mills & Cawood | 6,127,329 |
| 41 | HOK | 5,876,913 |
| 42 | BSA LifeStructures | 5,789,413 |
| 43 | NTD Architecture | 5,586,000 |
| 44 | LMN Architects | 5,549,900 |
| 45 | Ratio Architects | 5,537,316 |
| 46 | Leo A Daly | 5,395,356 |
| 47 | Bergmann Associates | 5,304,175 |
| 48 | Little | 5,249,190 |
| 49 | Hammel, Green and Abrahamson | 4,836,088 |
| 50 | Legat Architects | 4,685,600 |
| 51 | GBBN Architects | 4,560,000 |
| 52 | Carrier Johnson + Culture | 4,060,468 |
| 53 | Parkhill, Smith & Cooper | 4,026,000 |
| 54 | Cooper Carry | 3,961,244 |
| 55 | CTA Architects Engineers | 3,737,320 |
| 56 | Cambridge Seven Associates | 3,473,000 |
| 57 | PGAL | 3,260,300 |
| 58 | BLDD Architects | 3,000,000 |
| 59 | IBI Group ? Gruzen Samton | 3,000,000 |
| 60 | Kohn Pedersen Fox Associates | 2,974,000 |
| 61 | Slaterpaull Architects | 2,879,532 |
| 62 | Hord Coplan Macht | 2,843,072 |
| 63 | OZ Architecture | 2,825,000 |
| 64 | Kirksey | 2,822,225 |
| 65 | Rule Joy Trammell + Rubio | 2,801,380 |
| 66 | WDG Architecture | 2,757,000 |
| 67 | RS&H | 2,450,000 |
| 68 | SchenkelShultz Architecture | 2,386,000 |
| 69 | Payette | 2,282,352 |
| 70 | Corgan | 2,202,280 |
| 71 | Integrus Architecture | 2,191,762 |
| 72 | BLTa | 2,175,000 |
| 73 | H3 Hardy Collaboration Architecture | 2,141,323 |
| 74 | WHR Architects | 1,958,367 |
| 75 | Baskervill | 1,853,208 |
| 76 | Ashley McGraw Architects | 1,836,510 |
| 77 | KZF Design | 1,698,300 |
| 78 | Eppstein Uhen Architects | 1,691,787 |
| 79 | VOA Associates | 1,628,847 |
| 80 | GWWO | 1,623,501 |
| 81 | Wight & Company | 1,586,000 |
| 82 | Hoffmann Architects | 1,548,000 |
| 83 | Symmes Maini & McKee Associates | 1,530,000 |
| 84 | PBK | 1,500,000 |
| 85 | NAC|Architecture | 1,424,431 |
| 86 | LaBella Associates | 1,310,186 |
| 87 | Niles Bolton Associates | 1,263,210 |
| 88 | Nelson | 1,213,987 |
| 89 | Fentress Architects | 1,120,400 |
| 90 | Urban Design Group | 1,100,000 |
| 91 | Environetics | 1,087,370 |
| 92 | NORR | 1,052,484 |
| 93 | Becker Morgan Group | 1,037,159 |
| 94 | Albert Kahn Associates | 904,065 |
| 95 | RTKL Associates | 849,000 |
| 96 | Good Fulton & Farrell | 815,800 |
| 97 | Goettsch Partners | 810,000 |
| 98 | BBS Architects | 800,240 |
| 99 | Commonwealth Architects | 775,074 |
| 100 | Francis Cauffman | 707,774 |
| 101 | RNL | 690,000 |
| 102 | RBB Architects | 657,149 |
| 103 | RSP Architects | 620,000 |
| 104 | Gresham, Smith and Partners | 567,000 |
| 105 | Fanning/Howey Associates | 541,000 |
| 106 | Rosser International | 539,460 |
| 107 | Harvard Jolly Architecture | 530,103 |
| 108 | DesignGroup | 457,970 |
| 109 | Hnedak Bobo Group | 353,000 |
| 110 | JRS Architect | 295,000 |
| 111 | Emersion Design | 273,766 |
| 112 | Ware Malcomb | 240,000 |
| 113 | H+L Architecture | 236,252 |
| 114 | Smallwood, Reynolds, Stewart, Stewart & Associates | 226,716 |
| 115 | Sherlock, Smith & Adams | 219,000 |
Top University Sector Engineering Firms
| Rank | Company | 2013 Higher Ed Revenue |
| 1 | AECOM Technology Corp. | $76,410,000 |
| 2 | Jacobs | 35,150,000 |
| 3 | URS Corp. | 29,434,668 |
| 4 | Vanderweil Engineers | 26,614,500 |
| 5 | Burns & McDonnell | 24,152,332 |
| 6 | Affiliated Engineers | 22,469,000 |
| 7 | Parsons Brinckerhoff | 20,057,993 |
| 8 | STV | 18,416,000 |
| 9 | Arup | 14,561,909 |
| 10 | KJWW Engineering Consultants | 13,071,767 |
| 11 | BR+A Consulting Engineers | 10,120,000 |
| 12 | WSP Group | 9,120,000 |
| 13 | Simpson Gumpertz & Heger | 9,070,000 |
| 14 | Thornton Tomasetti | 7,942,631 |
| 15 | M-E Engineers | 7,243,000 |
| 16 | P2S Engineering | 7,170,208 |
| 17 | Shive-Hattery | 6,612,598 |
| 18 | Wiss, Janney, Elstner Associates | 6,550,000 |
| 19 | Dewberry | 6,331,593 |
| 20 | Environmental Systems Design | 6,144,227 |
| 21 | RMF Engineering | 5,400,000 |
| 22 | AKF Group | 5,261,000 |
| 23 | Glumac | 4,922,565 |
| 24 | M/E Engineering | 4,699,367 |
| 25 | TTG | 4,600,100 |
| 26 | Newcomb & Boyd | 4,505,166 |
| 27 | RDK Engineers | 4,490,000 |
| 28 | Heapy Engineering | 4,426,631 |
| 29 | KCI Technologies | 4,400,000 |
| 30 | Interface Engineering | 4,351,590 |
| 31 | Joseph R. Loring & Associates | 4,100,000 |
| 32 | I. C. Thomasson Associates | 3,500,000 |
| 33 | Spectrum Engineers | 3,347,542 |
| 34 | Highland Associates | 3,200,000 |
| 35 | KPFF Consulting Engineers | 3,125,000 |
| 36 | Syska Hennessy Group | 3,072,512 |
| 37 | Ross & Baruzzini | 3,043,445 |
| 38 | H.F. Lenz | 2,878,115 |
| 39 | Rist-Frost-Shumway Engineering | 2,850,000 |
| 40 | Sparling | 2,553,080 |
| 41 | Smith Seckman Reid | 2,519,005 |
| 42 | Martin/Martin | 2,263,812 |
| 43 | Karpinski Engineering | 2,170,197 |
| 44 | Aon Fire Protection Engineering Corp. | 2,000,000 |
| 45 | Fishbeck, Thompson, Carr & Huber | 2,000,000 |
| 46 | SSOE Group | 1,912,012 |
| 47 | Henderson Engineers | 1,838,909 |
| 48 | TLC Engineering for Architecture | 1,806,782 |
| 49 | Zak Companies | 1,706,697 |
| 50 | Bridgers & Paxton Consulting Engineers | 1,686,953 |
| 51 | CJL Engineering | 1,657,350 |
| 52 | Graef | 1,584,321 |
| 53 | Primera Engineers | 1,456,000 |
| 54 | CCRD Partners | 1,388,000 |
| 55 | Brinjac Engineering | 1,303,855 |
| 56 | Paulus, Sokolowski and Sartor | 1,200,000 |
| 57 | Wallace Engineering | 1,133,000 |
| 58 | Stanley Consultants | 1,090,529 |
| 59 | Leidos | 1,040,000 |
| 60 | Walter P Moore and Associates | 1,005,161 |
| 61 | Allen & Shariff | 1,000,000 |
| 62 | Dunham Associates | 950,000 |
| 63 | Bala Consulting Engineers | 926,000 |
| 64 | Degenkolb Engineers | 855,093 |
| 65 | OLA Consulting Engineers | 840,000 |
| 66 | Mazzetti | 774,981 |
| 67 | DeSimone Consulting Engineers | 474,096 |
| 68 | KLH Engineers | 468,745 |
| 69 | ThermalTech Engineering | 460,000 |
| 70 | French & Parrello Associates | 300,690 |
| 71 | GHT Limited | 260,000 |
| 72 | Wick Fisher White | 223,276 |
| 73 | CTLGroup | 220,000 |
| 74 | Davis, Bowen & Friedel | 204,422 |
| 75 | Barge Waggoner Sumner & Cannon | 200,000 |
| 76 | Magnusson Klemencic Associates | 166,730 |
| 77 | Coffman Engineers | 116,263 |
Top University Sector Construction Firms
| Rank | Company | 2013 Higher Ed Revenue |
| 1 | Whiting-Turner Contracting Co., The | $818,698,552 |
| 2 | Turner Construction | 774,984,000 |
| 3 | Gilbane | 475,524,757 |
| 4 | Skanska USA | 371,024,162 |
| 5 | PCL Construction | 368,990,947 |
| 6 | Clark Group | 312,942,079 |
| 7 | Shawmut Design and Construction | 265,610,000 |
| 8 | Barton Malow | 264,908,516 |
| 9 | Structure Tone | 229,539,000 |
| 10 | Consigli Construction | 227,995,719 |
| 11 | Mortenson Construction | 220,320,000 |
| 12 | McCarthy Holdings | 203,600,000 |
| 13 | Sundt Construction | 185,867,366 |
| 14 | Holder Construction | 176,219,000 |
| 15 | Messer Construction | 172,997,147 |
| 16 | Balfour Beatty US | 171,519,250 |
| 17 | JE Dunn Construction | 164,791,311 |
| 18 | LeChase Construction Services | 164,000,000 |
| 19 | Walbridge | 163,500,000 |
| 20 | Power Construction | 159,000,000 |
| 21 | Beck Group, The | 157,055,739 |
| 22 | Suffolk Construction | 149,745,824 |
| 23 | Tutor Perini Corp. | 145,671,900 |
| 24 | DPR Construction | 140,724,634 |
| 25 | W. M. Jordan Company | 130,566,823 |
| 26 | C.W. Driver | 127,735,000 |
| 27 | Flintco | 113,500,000 |
| 28 | Walsh Group, The | 111,960,180 |
| 29 | Boldt Company, The | 107,802,444 |
| 30 | Brasfield & Gorrie | 107,242,213 |
| 31 | Juneau Construction | 97,432,186 |
| 32 | Manhattan Construction | 89,176,000 |
| 33 | Rodgers Builders | 88,744,572 |
| 34 | McGough | 82,000,000 |
| 35 | Summit Contracting Group | 80,286,141 |
| 36 | Choate Construction | 77,541,745 |
| 37 | Pepper Construction | 72,000,000 |
| 38 | Hathaway Dinwiddie Construction | 66,219,000 |
| 39 | Bernards | 66,000,000 |
| 40 | Hensel Phelps | 65,670,000 |
| 41 | O'Neil Industries/W.E. O'Neil | 65,552,134 |
| 42 | Kraus-Anderson Construction | 64,000,000 |
| 43 | Hunt Construction Group | 64,000,000 |
| 44 | B. L. Harbert International | 63,854,476 |
| 45 | Lend Lease | 56,720,000 |
| 46 | CORE Construction Group | 55,821,501 |
| 47 | Fortis Construction | 53,628,000 |
| 48 | Layton Construction | 52,600,000 |
| 49 | Paric Corp. | 50,000,000 |
| 50 | New South Construction | 47,702,000 |
| 51 | Hill & Wilkinson | 46,288,000 |
| 52 | Austin Commercial | 44,335,793 |
| 53 | Yates Companies, The | 42,800,000 |
| 54 | Bette Companies, The | 38,929,000 |
| 55 | Hoffman Construction | 37,000,000 |
| 56 | Coakley & Williams Construction | 32,064,969 |
| 57 | Adolfson & Peterson Construction | 30,713,572 |
| 58 | URS Corp. | 29,434,668 |
| 59 | James G. Davis Construction | 27,506,326 |
| 60 | Weitz Company, The | 26,478,980 |
| 61 | Bomel Construction | 24,949,344 |
| 62 | Linbeck Group | 24,410,000 |
| 63 | LPCiminelli | 23,426,935 |
| 64 | IMC Construction | 22,086,310 |
| 65 | Hill International | 22,000,000 |
| 66 | HITT Contracting | 20,900,000 |
| 67 | E.W. Howell | 20,566,000 |
| 68 | Parsons Brinckerhoff | 20,057,993 |
| 69 | STV | 18,416,000 |
| 70 | Stalco Construction | 17,780,000 |
| 71 | Haselden Construction | 17,425,677 |
| 72 | Kitchell Corp. | 13,043,551 |
| 73 | Hoar Construction | 12,920,000 |
| 74 | Batson-Cook | 12,513,549 |
| 75 | Absher Construction | 12,280,813 |
| 76 | S. M. Wilson & Co. | 10,863,488 |
| 77 | James McHugh Construction | 10,538,534 |
| 78 | Robins & Morton | 8,714,264 |
| 79 | Clune Construction | 8,635,947 |
| 80 | Haskell | 8,294,931 |
| 81 | Alberici Constructors | 7,380,631 |
| 82 | Heery International | 7,186,274 |
| 83 | Wight & Company | 4,935,000 |
| 84 | Gray Construction | 3,880,000 |
| 85 | Ryan Companies US | 3,715,948 |
| 86 | KBE Building Corp. | 2,694,826 |
| 87 | Leopardo Companies | 1,907,266 |
| 88 | Douglas Company, The | 1,507,502 |
| 89 | JLL | 1,375,045 |
| 90 | Astorino | 1,222,033 |
| 91 | Allen & Shariff | 1,000,000 |
Read BD+C's full 2014 Giants 300 Report
Related Stories

| Aug 11, 2014
New guide for prevention of thermal bridging in commercial buildings
The guide aims to overcome obstacles with respect to mitigating thermal bridging to reduce energy consumption in buildings.

| Aug 8, 2014
LEGO launches set aimed at professional architects
LEGO Architecture Studio is made up of 76 unique elements and over 1,200 pieces, and is intended to give the builder as much freedom as possible.

| Aug 8, 2014
First look: China's latest office development will take the shape of binary code
The Window of Guangzhou project will consist of three towers forming the number sequence "001."
 Regional Transportation Intermodal Center is a project of the cit")
| Aug 8, 2014
Government Sector Giants: Public-sector construction slow, but stirring [2014 Giants 300 Report]
Improving energy performance of existing properties through targeted upgrades and large-scale reconstruction continues to be a federal priority, according to BD+C's 2014 Giants 300 Report.
Sponsored | | Aug 8, 2014
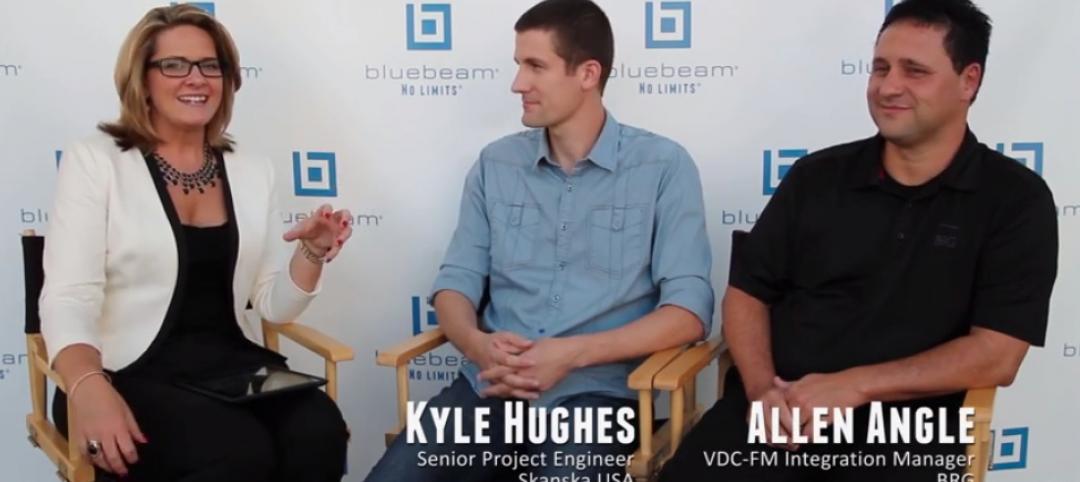
Setting guidelines for construction PDF documents across the AEC industry
Sasha Reed interviews two members of the coalition responsible for creating new Guidelines for Construction PDF Documents. SPONSORED CONTENT

Sponsored | | Aug 8, 2014
Safe and secure: Fire and security glazing solution for Plaquemines Parish Detention Center
When the designers at L. R. Kimball looked for an all-in-one clear, wire-free glazing solution that protects against fire, bullets and forced entry for the new Plaquemines Parish Detention Center, SAFTI FIRST supplied a complete single-source tested and listed assembly that was easy to install and maintenance-free.

| Aug 7, 2014
Office Sector Giants: ‘Flex’ reigns supreme in hot office construction market [2014 BD+C Giants 300 Report]
The adage “doing more with less” has become a byword for many businesses since the Great Recession, and clients are trying to maximize every precious inch, according to BD+C's 2014 Giants 300 Report.

| Aug 6, 2014
BIG reinvents the zoo with its 'Zootopia' natural habitat concept [slideshow]
Bjarke Ingels’ firm is looking to improve the 1960s-designed Givskund Zoo in Denmark by giving the animals a freer range to roam.

| Aug 6, 2014
The Dead Prize: A new award to recognize poorly designed buildings
If the film industry has its Razzie awards, architecture will have its Dead Prize, created by Architecture for Humanity co-founder Cameron Sinclair to recognize projects that actively harm the planet.

| Aug 6, 2014
25 projects win awards for design-build excellence
The 2014 Design-Build Project/Team Awards showcase design-build best practices and celebrate the achievements of owners and design-build teams in nine categories across the spectrum of horizontal and vertical construction.


