


An analysis of Dun & Bradstreet stats by consultant Paul Abramson indicates that some $11 billion was spent on higher ed construction last year—up a billion from 2012, with nearly 70% comprising new buildings (http://bit.ly/1qhMzaw).
As examined in BD+C’s in-depth May report, university stakeholders face complicated cap-ex stressors, from chronic (lender stinginess, deferred maintenance) to impending (President Obama’s pledge to start rating colleges on value delivered, consumer pushback on ever-rising costs).
Creative approaches to financing, design, and delivery are top-of-mind. Paula Stamp, Business Development Manager in the Los Angeles office of PCL Construction, says clients are exploring CM at risk, design-build, and design risk. Margie Simmons, VP and Education Sector Leader at Stantec, adds: “Higher debt levels will encourage institutions to seek off-balance-sheet financing solutions and P3s.”
Teri Jones, VP at Sundt Construction, sees a similar pattern, plus emphasis on revenue-generating buildings like dorms and recreation centers.
Facility trends observed by Stamp include housing construction by community colleges (serving a growing international-student population) and better use of indoor and outdoor circulation and common space. John Baxter, Education Sector Leader at EYP, says clients are asking for features that enhance an interactive “corridor culture” in dorms.
Michael Medici, AIA, NCARB, Learning Practice Leader and Senior VP at SmithGroupJJR, mentions growing demand for facilities that support interprofessional health sciences education and project-based, career-oriented learning. Also gaining traction: office zones that mimic private-sector workplaces, with less assigned space and more team zones.
Perkins+Will higher ed designers Jeff Ziebarth, Jeff Stebar, and John Long are also seeing this pattern; Long says younger faculty and administrators have been a lot more receptive than veterans.
Top University Sector Architecture Firms
| Rank | Company | 2013 Higher Ed Revenue |
| 1 | CannonDesign | $76,000,000 |
| 2 | Perkins+will | 45,582,532 |
| 3 | Stantec | 42,368,888 |
| 4 | EYP Architecture & Engineering | 39,000,000 |
| 5 | Gensler | 29,492,000 |
| 6 | SmithGroupJJR | 27,088,190 |
| 7 | Clark Nexsen | 21,732,694 |
| 8 | Skidmore, Owings & Merrill | 20,933,579 |
| 9 | Page | 19,771,000 |
| 10 | ZGF Architects | 19,397,489 |
| 11 | Wilson Architects | 18,500,000 |
| 12 | Ennead Architects | 18,086,505 |
| 13 | Flad Architects | 16,260,000 |
| 14 | SHW Group | 15,991,000 |
| 15 | Shepley Bulfinch | 15,595,000 |
| 16 | Harley Ellis Devereaux | 15,120,000 |
| 17 | Moseley Architects | 15,016,516 |
| 18 | Lord Aeck Sargent | 13,533,882 |
| 19 | HMC Architects | 13,440,933 |
| 20 | NBBJ | 13,242,000 |
| 21 | HKS | 12,847,559 |
| 22 | Ballinger | 12,113,215 |
| 23 | Beyer Blinder Belle | 11,627,926 |
| 24 | DLR Group | 11,100,000 |
| 25 | LS3P | 10,532,964 |
| 26 | Morris Architects | 10,000,000 |
| 27 | Solomon Cordwell Buenz | 10,000,000 |
| 28 | Davis Brody Bond | 9,835,655 |
| 29 | FGM Architects | 9,821,820 |
| 30 | LPA | 9,561,760 |
| 31 | Perkins Eastman | 9,300,000 |
| 32 | Moody Nolan | 9,104,965 |
| 33 | CO Architects | 8,912,400 |
| 34 | EwingCole | 7,430,000 |
| 35 | Heery International | 7,186,274 |
| 36 | Hastings+Chivetta Architects | 6,378,602 |
| 37 | Westlake Reed Leskosky | 6,325,000 |
| 38 | FXFOWLE Architects | 6,200,000 |
| 39 | Mithun | 6,158,000 |
| 40 | Goodwyn Mills & Cawood | 6,127,329 |
| 41 | HOK | 5,876,913 |
| 42 | BSA LifeStructures | 5,789,413 |
| 43 | NTD Architecture | 5,586,000 |
| 44 | LMN Architects | 5,549,900 |
| 45 | Ratio Architects | 5,537,316 |
| 46 | Leo A Daly | 5,395,356 |
| 47 | Bergmann Associates | 5,304,175 |
| 48 | Little | 5,249,190 |
| 49 | Hammel, Green and Abrahamson | 4,836,088 |
| 50 | Legat Architects | 4,685,600 |
| 51 | GBBN Architects | 4,560,000 |
| 52 | Carrier Johnson + Culture | 4,060,468 |
| 53 | Parkhill, Smith & Cooper | 4,026,000 |
| 54 | Cooper Carry | 3,961,244 |
| 55 | CTA Architects Engineers | 3,737,320 |
| 56 | Cambridge Seven Associates | 3,473,000 |
| 57 | PGAL | 3,260,300 |
| 58 | BLDD Architects | 3,000,000 |
| 59 | IBI Group ? Gruzen Samton | 3,000,000 |
| 60 | Kohn Pedersen Fox Associates | 2,974,000 |
| 61 | Slaterpaull Architects | 2,879,532 |
| 62 | Hord Coplan Macht | 2,843,072 |
| 63 | OZ Architecture | 2,825,000 |
| 64 | Kirksey | 2,822,225 |
| 65 | Rule Joy Trammell + Rubio | 2,801,380 |
| 66 | WDG Architecture | 2,757,000 |
| 67 | RS&H | 2,450,000 |
| 68 | SchenkelShultz Architecture | 2,386,000 |
| 69 | Payette | 2,282,352 |
| 70 | Corgan | 2,202,280 |
| 71 | Integrus Architecture | 2,191,762 |
| 72 | BLTa | 2,175,000 |
| 73 | H3 Hardy Collaboration Architecture | 2,141,323 |
| 74 | WHR Architects | 1,958,367 |
| 75 | Baskervill | 1,853,208 |
| 76 | Ashley McGraw Architects | 1,836,510 |
| 77 | KZF Design | 1,698,300 |
| 78 | Eppstein Uhen Architects | 1,691,787 |
| 79 | VOA Associates | 1,628,847 |
| 80 | GWWO | 1,623,501 |
| 81 | Wight & Company | 1,586,000 |
| 82 | Hoffmann Architects | 1,548,000 |
| 83 | Symmes Maini & McKee Associates | 1,530,000 |
| 84 | PBK | 1,500,000 |
| 85 | NAC|Architecture | 1,424,431 |
| 86 | LaBella Associates | 1,310,186 |
| 87 | Niles Bolton Associates | 1,263,210 |
| 88 | Nelson | 1,213,987 |
| 89 | Fentress Architects | 1,120,400 |
| 90 | Urban Design Group | 1,100,000 |
| 91 | Environetics | 1,087,370 |
| 92 | NORR | 1,052,484 |
| 93 | Becker Morgan Group | 1,037,159 |
| 94 | Albert Kahn Associates | 904,065 |
| 95 | RTKL Associates | 849,000 |
| 96 | Good Fulton & Farrell | 815,800 |
| 97 | Goettsch Partners | 810,000 |
| 98 | BBS Architects | 800,240 |
| 99 | Commonwealth Architects | 775,074 |
| 100 | Francis Cauffman | 707,774 |
| 101 | RNL | 690,000 |
| 102 | RBB Architects | 657,149 |
| 103 | RSP Architects | 620,000 |
| 104 | Gresham, Smith and Partners | 567,000 |
| 105 | Fanning/Howey Associates | 541,000 |
| 106 | Rosser International | 539,460 |
| 107 | Harvard Jolly Architecture | 530,103 |
| 108 | DesignGroup | 457,970 |
| 109 | Hnedak Bobo Group | 353,000 |
| 110 | JRS Architect | 295,000 |
| 111 | Emersion Design | 273,766 |
| 112 | Ware Malcomb | 240,000 |
| 113 | H+L Architecture | 236,252 |
| 114 | Smallwood, Reynolds, Stewart, Stewart & Associates | 226,716 |
| 115 | Sherlock, Smith & Adams | 219,000 |
Top University Sector Engineering Firms
| Rank | Company | 2013 Higher Ed Revenue |
| 1 | AECOM Technology Corp. | $76,410,000 |
| 2 | Jacobs | 35,150,000 |
| 3 | URS Corp. | 29,434,668 |
| 4 | Vanderweil Engineers | 26,614,500 |
| 5 | Burns & McDonnell | 24,152,332 |
| 6 | Affiliated Engineers | 22,469,000 |
| 7 | Parsons Brinckerhoff | 20,057,993 |
| 8 | STV | 18,416,000 |
| 9 | Arup | 14,561,909 |
| 10 | KJWW Engineering Consultants | 13,071,767 |
| 11 | BR+A Consulting Engineers | 10,120,000 |
| 12 | WSP Group | 9,120,000 |
| 13 | Simpson Gumpertz & Heger | 9,070,000 |
| 14 | Thornton Tomasetti | 7,942,631 |
| 15 | M-E Engineers | 7,243,000 |
| 16 | P2S Engineering | 7,170,208 |
| 17 | Shive-Hattery | 6,612,598 |
| 18 | Wiss, Janney, Elstner Associates | 6,550,000 |
| 19 | Dewberry | 6,331,593 |
| 20 | Environmental Systems Design | 6,144,227 |
| 21 | RMF Engineering | 5,400,000 |
| 22 | AKF Group | 5,261,000 |
| 23 | Glumac | 4,922,565 |
| 24 | M/E Engineering | 4,699,367 |
| 25 | TTG | 4,600,100 |
| 26 | Newcomb & Boyd | 4,505,166 |
| 27 | RDK Engineers | 4,490,000 |
| 28 | Heapy Engineering | 4,426,631 |
| 29 | KCI Technologies | 4,400,000 |
| 30 | Interface Engineering | 4,351,590 |
| 31 | Joseph R. Loring & Associates | 4,100,000 |
| 32 | I. C. Thomasson Associates | 3,500,000 |
| 33 | Spectrum Engineers | 3,347,542 |
| 34 | Highland Associates | 3,200,000 |
| 35 | KPFF Consulting Engineers | 3,125,000 |
| 36 | Syska Hennessy Group | 3,072,512 |
| 37 | Ross & Baruzzini | 3,043,445 |
| 38 | H.F. Lenz | 2,878,115 |
| 39 | Rist-Frost-Shumway Engineering | 2,850,000 |
| 40 | Sparling | 2,553,080 |
| 41 | Smith Seckman Reid | 2,519,005 |
| 42 | Martin/Martin | 2,263,812 |
| 43 | Karpinski Engineering | 2,170,197 |
| 44 | Aon Fire Protection Engineering Corp. | 2,000,000 |
| 45 | Fishbeck, Thompson, Carr & Huber | 2,000,000 |
| 46 | SSOE Group | 1,912,012 |
| 47 | Henderson Engineers | 1,838,909 |
| 48 | TLC Engineering for Architecture | 1,806,782 |
| 49 | Zak Companies | 1,706,697 |
| 50 | Bridgers & Paxton Consulting Engineers | 1,686,953 |
| 51 | CJL Engineering | 1,657,350 |
| 52 | Graef | 1,584,321 |
| 53 | Primera Engineers | 1,456,000 |
| 54 | CCRD Partners | 1,388,000 |
| 55 | Brinjac Engineering | 1,303,855 |
| 56 | Paulus, Sokolowski and Sartor | 1,200,000 |
| 57 | Wallace Engineering | 1,133,000 |
| 58 | Stanley Consultants | 1,090,529 |
| 59 | Leidos | 1,040,000 |
| 60 | Walter P Moore and Associates | 1,005,161 |
| 61 | Allen & Shariff | 1,000,000 |
| 62 | Dunham Associates | 950,000 |
| 63 | Bala Consulting Engineers | 926,000 |
| 64 | Degenkolb Engineers | 855,093 |
| 65 | OLA Consulting Engineers | 840,000 |
| 66 | Mazzetti | 774,981 |
| 67 | DeSimone Consulting Engineers | 474,096 |
| 68 | KLH Engineers | 468,745 |
| 69 | ThermalTech Engineering | 460,000 |
| 70 | French & Parrello Associates | 300,690 |
| 71 | GHT Limited | 260,000 |
| 72 | Wick Fisher White | 223,276 |
| 73 | CTLGroup | 220,000 |
| 74 | Davis, Bowen & Friedel | 204,422 |
| 75 | Barge Waggoner Sumner & Cannon | 200,000 |
| 76 | Magnusson Klemencic Associates | 166,730 |
| 77 | Coffman Engineers | 116,263 |
Top University Sector Construction Firms
| Rank | Company | 2013 Higher Ed Revenue |
| 1 | Whiting-Turner Contracting Co., The | $818,698,552 |
| 2 | Turner Construction | 774,984,000 |
| 3 | Gilbane | 475,524,757 |
| 4 | Skanska USA | 371,024,162 |
| 5 | PCL Construction | 368,990,947 |
| 6 | Clark Group | 312,942,079 |
| 7 | Shawmut Design and Construction | 265,610,000 |
| 8 | Barton Malow | 264,908,516 |
| 9 | Structure Tone | 229,539,000 |
| 10 | Consigli Construction | 227,995,719 |
| 11 | Mortenson Construction | 220,320,000 |
| 12 | McCarthy Holdings | 203,600,000 |
| 13 | Sundt Construction | 185,867,366 |
| 14 | Holder Construction | 176,219,000 |
| 15 | Messer Construction | 172,997,147 |
| 16 | Balfour Beatty US | 171,519,250 |
| 17 | JE Dunn Construction | 164,791,311 |
| 18 | LeChase Construction Services | 164,000,000 |
| 19 | Walbridge | 163,500,000 |
| 20 | Power Construction | 159,000,000 |
| 21 | Beck Group, The | 157,055,739 |
| 22 | Suffolk Construction | 149,745,824 |
| 23 | Tutor Perini Corp. | 145,671,900 |
| 24 | DPR Construction | 140,724,634 |
| 25 | W. M. Jordan Company | 130,566,823 |
| 26 | C.W. Driver | 127,735,000 |
| 27 | Flintco | 113,500,000 |
| 28 | Walsh Group, The | 111,960,180 |
| 29 | Boldt Company, The | 107,802,444 |
| 30 | Brasfield & Gorrie | 107,242,213 |
| 31 | Juneau Construction | 97,432,186 |
| 32 | Manhattan Construction | 89,176,000 |
| 33 | Rodgers Builders | 88,744,572 |
| 34 | McGough | 82,000,000 |
| 35 | Summit Contracting Group | 80,286,141 |
| 36 | Choate Construction | 77,541,745 |
| 37 | Pepper Construction | 72,000,000 |
| 38 | Hathaway Dinwiddie Construction | 66,219,000 |
| 39 | Bernards | 66,000,000 |
| 40 | Hensel Phelps | 65,670,000 |
| 41 | O'Neil Industries/W.E. O'Neil | 65,552,134 |
| 42 | Kraus-Anderson Construction | 64,000,000 |
| 43 | Hunt Construction Group | 64,000,000 |
| 44 | B. L. Harbert International | 63,854,476 |
| 45 | Lend Lease | 56,720,000 |
| 46 | CORE Construction Group | 55,821,501 |
| 47 | Fortis Construction | 53,628,000 |
| 48 | Layton Construction | 52,600,000 |
| 49 | Paric Corp. | 50,000,000 |
| 50 | New South Construction | 47,702,000 |
| 51 | Hill & Wilkinson | 46,288,000 |
| 52 | Austin Commercial | 44,335,793 |
| 53 | Yates Companies, The | 42,800,000 |
| 54 | Bette Companies, The | 38,929,000 |
| 55 | Hoffman Construction | 37,000,000 |
| 56 | Coakley & Williams Construction | 32,064,969 |
| 57 | Adolfson & Peterson Construction | 30,713,572 |
| 58 | URS Corp. | 29,434,668 |
| 59 | James G. Davis Construction | 27,506,326 |
| 60 | Weitz Company, The | 26,478,980 |
| 61 | Bomel Construction | 24,949,344 |
| 62 | Linbeck Group | 24,410,000 |
| 63 | LPCiminelli | 23,426,935 |
| 64 | IMC Construction | 22,086,310 |
| 65 | Hill International | 22,000,000 |
| 66 | HITT Contracting | 20,900,000 |
| 67 | E.W. Howell | 20,566,000 |
| 68 | Parsons Brinckerhoff | 20,057,993 |
| 69 | STV | 18,416,000 |
| 70 | Stalco Construction | 17,780,000 |
| 71 | Haselden Construction | 17,425,677 |
| 72 | Kitchell Corp. | 13,043,551 |
| 73 | Hoar Construction | 12,920,000 |
| 74 | Batson-Cook | 12,513,549 |
| 75 | Absher Construction | 12,280,813 |
| 76 | S. M. Wilson & Co. | 10,863,488 |
| 77 | James McHugh Construction | 10,538,534 |
| 78 | Robins & Morton | 8,714,264 |
| 79 | Clune Construction | 8,635,947 |
| 80 | Haskell | 8,294,931 |
| 81 | Alberici Constructors | 7,380,631 |
| 82 | Heery International | 7,186,274 |
| 83 | Wight & Company | 4,935,000 |
| 84 | Gray Construction | 3,880,000 |
| 85 | Ryan Companies US | 3,715,948 |
| 86 | KBE Building Corp. | 2,694,826 |
| 87 | Leopardo Companies | 1,907,266 |
| 88 | Douglas Company, The | 1,507,502 |
| 89 | JLL | 1,375,045 |
| 90 | Astorino | 1,222,033 |
| 91 | Allen & Shariff | 1,000,000 |
Read BD+C's full 2014 Giants 300 Report
Related Stories

Sponsored | | Oct 13, 2014
Liberty Utilities protects installers with Viega MegaPress
Liberty Utilities of New Hampshire wanted a way to keep its installers safe without compromising the quality of their installations, which is why the utility provider decided to start installing Viega MegaPress. SPONSORED CONTENT
| Oct 13, 2014
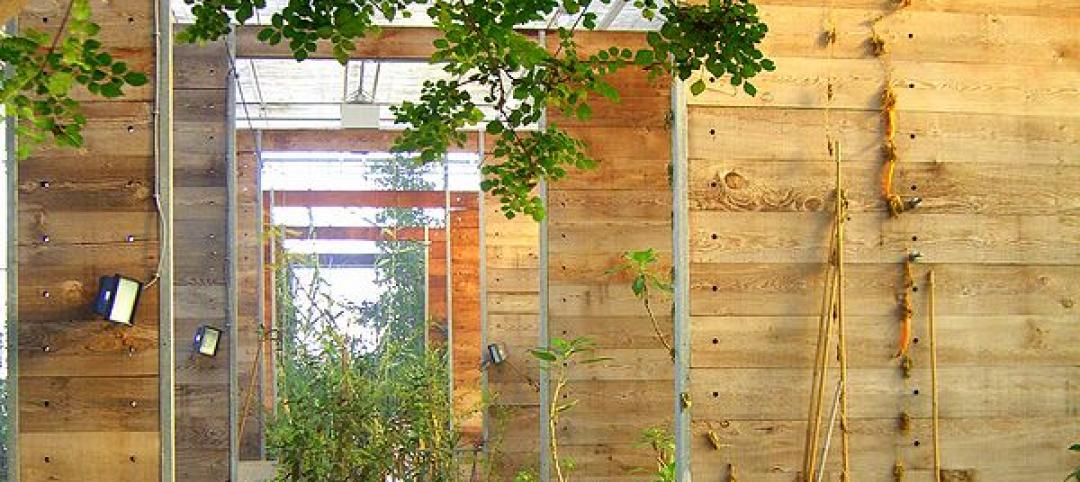
Department of Agriculture launches Tall Wood Building Competition
The competition invites U.S. developers, institutions, organizations, and design teams willing to undertake an alternative solution approach to designing and building taller wood structures to submit entries for a prize of $2 million.

| Oct 12, 2014
AIA 2030 commitment: Five years on, are we any closer to net-zero?
This year marks the fifth anniversary of the American Institute of Architects’ effort to have architecture firms voluntarily pledge net-zero energy design for all their buildings by 2030.

| Oct 10, 2014
A new memorial by Zaha Hadid in Cambodia departs from the expected
The project sees a departure from Hadid’s well-known use of concrete, fiberglass, and resin. Instead, the primary material will be timber, curved and symmetrical like the Angkor Wat and other Cambodian landmarks.

| Oct 9, 2014
Regulations, demand will accelerate revenue from zero energy buildings, according to study
A new study by Navigant Research projects that public- and private-sector efforts to lower the carbon footprint of new and renovated commercial and residential structures will boost the annual revenue generated by commercial and residential zero energy buildings over the next 20 years by 122.5%, to $1.4 trillion.

| Oct 9, 2014
More recession-postponed design projects are being resurrected, says AIA
About three quarters of the estimated 700 firms that serve as panelists on AIA’s Architectural Billings Index (ABI) had delayed or canceled major design projects in response to recessionary pressures. Nearly one-third of those firms now say they have since restarted stalled projects.

| Oct 9, 2014
Steven Holl's 'intersecting spheres' scheme for Taipei necropolis gets green light
The schematic design has been approved for the 50 000-sm Arrival Hall and Oceanic Pavilion for the Taiwan ChinPaoSan Necropolis.
| Oct 9, 2014
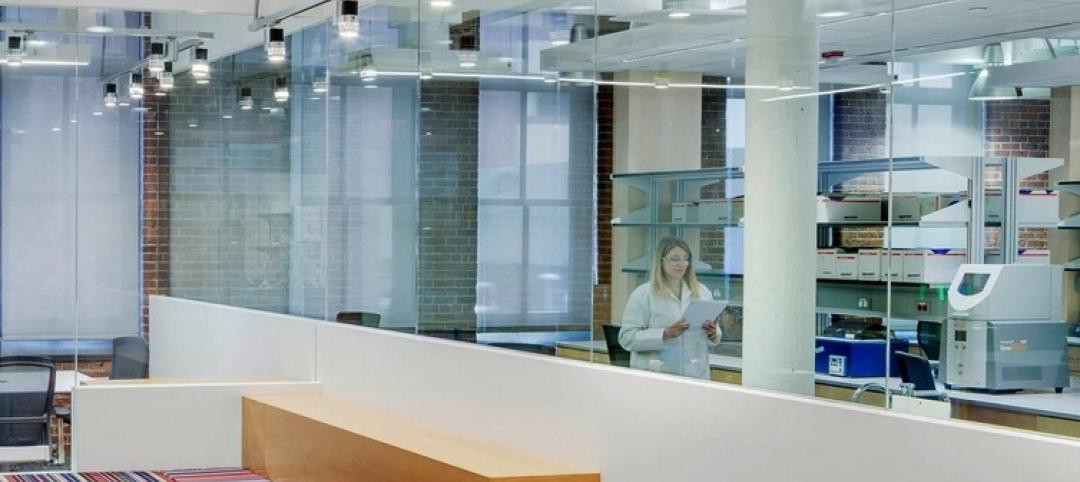
Beyond the bench: Meet the modern laboratory facility
Like office workers escaping from the perceived confines of cubicles, today’s scientists have been freed from the trappings of the typical lab bench, writes Perkins+Will's Bill Harris.
| Oct 8, 2014
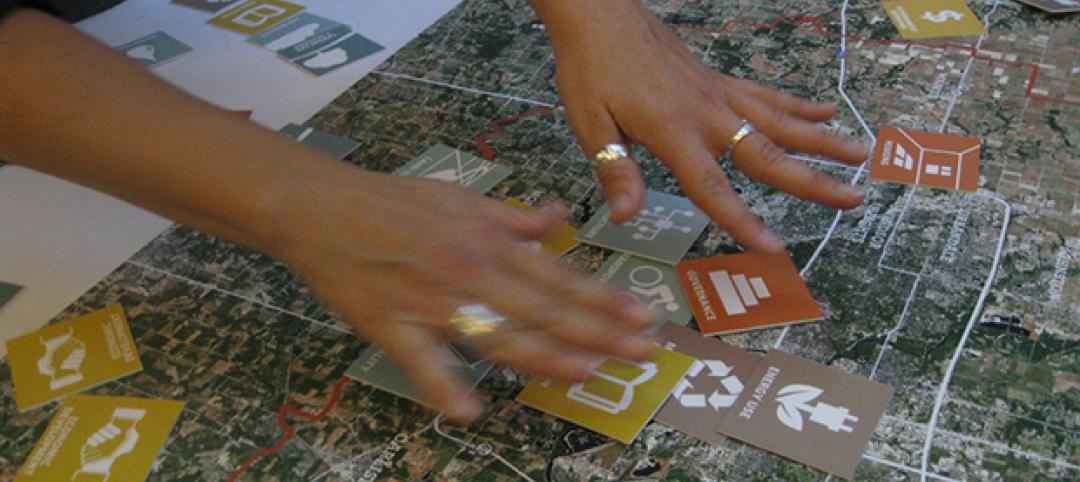
New tools for community feedback and action
Too often, members of a community are put into a reactive position, asked for their input only when a major project is proposed. But examples of proactive civic engagement are beginning to emerge, write James Miner and Jessie Bauters.

| Oct 8, 2014
Massive ‘healthcare village’ in Nevada touted as world’s largest healthcare project
The $1.2 billion Union Village project is expected to create 12,000 permanent jobs when completed by 2024.


