


An analysis of Dun & Bradstreet stats by consultant Paul Abramson indicates that some $11 billion was spent on higher ed construction last year—up a billion from 2012, with nearly 70% comprising new buildings (http://bit.ly/1qhMzaw).
As examined in BD+C’s in-depth May report, university stakeholders face complicated cap-ex stressors, from chronic (lender stinginess, deferred maintenance) to impending (President Obama’s pledge to start rating colleges on value delivered, consumer pushback on ever-rising costs).
Creative approaches to financing, design, and delivery are top-of-mind. Paula Stamp, Business Development Manager in the Los Angeles office of PCL Construction, says clients are exploring CM at risk, design-build, and design risk. Margie Simmons, VP and Education Sector Leader at Stantec, adds: “Higher debt levels will encourage institutions to seek off-balance-sheet financing solutions and P3s.”
Teri Jones, VP at Sundt Construction, sees a similar pattern, plus emphasis on revenue-generating buildings like dorms and recreation centers.
Facility trends observed by Stamp include housing construction by community colleges (serving a growing international-student population) and better use of indoor and outdoor circulation and common space. John Baxter, Education Sector Leader at EYP, says clients are asking for features that enhance an interactive “corridor culture” in dorms.
Michael Medici, AIA, NCARB, Learning Practice Leader and Senior VP at SmithGroupJJR, mentions growing demand for facilities that support interprofessional health sciences education and project-based, career-oriented learning. Also gaining traction: office zones that mimic private-sector workplaces, with less assigned space and more team zones.
Perkins+Will higher ed designers Jeff Ziebarth, Jeff Stebar, and John Long are also seeing this pattern; Long says younger faculty and administrators have been a lot more receptive than veterans.
Top University Sector Architecture Firms
| Rank | Company | 2013 Higher Ed Revenue |
| 1 | CannonDesign | $76,000,000 |
| 2 | Perkins+will | 45,582,532 |
| 3 | Stantec | 42,368,888 |
| 4 | EYP Architecture & Engineering | 39,000,000 |
| 5 | Gensler | 29,492,000 |
| 6 | SmithGroupJJR | 27,088,190 |
| 7 | Clark Nexsen | 21,732,694 |
| 8 | Skidmore, Owings & Merrill | 20,933,579 |
| 9 | Page | 19,771,000 |
| 10 | ZGF Architects | 19,397,489 |
| 11 | Wilson Architects | 18,500,000 |
| 12 | Ennead Architects | 18,086,505 |
| 13 | Flad Architects | 16,260,000 |
| 14 | SHW Group | 15,991,000 |
| 15 | Shepley Bulfinch | 15,595,000 |
| 16 | Harley Ellis Devereaux | 15,120,000 |
| 17 | Moseley Architects | 15,016,516 |
| 18 | Lord Aeck Sargent | 13,533,882 |
| 19 | HMC Architects | 13,440,933 |
| 20 | NBBJ | 13,242,000 |
| 21 | HKS | 12,847,559 |
| 22 | Ballinger | 12,113,215 |
| 23 | Beyer Blinder Belle | 11,627,926 |
| 24 | DLR Group | 11,100,000 |
| 25 | LS3P | 10,532,964 |
| 26 | Morris Architects | 10,000,000 |
| 27 | Solomon Cordwell Buenz | 10,000,000 |
| 28 | Davis Brody Bond | 9,835,655 |
| 29 | FGM Architects | 9,821,820 |
| 30 | LPA | 9,561,760 |
| 31 | Perkins Eastman | 9,300,000 |
| 32 | Moody Nolan | 9,104,965 |
| 33 | CO Architects | 8,912,400 |
| 34 | EwingCole | 7,430,000 |
| 35 | Heery International | 7,186,274 |
| 36 | Hastings+Chivetta Architects | 6,378,602 |
| 37 | Westlake Reed Leskosky | 6,325,000 |
| 38 | FXFOWLE Architects | 6,200,000 |
| 39 | Mithun | 6,158,000 |
| 40 | Goodwyn Mills & Cawood | 6,127,329 |
| 41 | HOK | 5,876,913 |
| 42 | BSA LifeStructures | 5,789,413 |
| 43 | NTD Architecture | 5,586,000 |
| 44 | LMN Architects | 5,549,900 |
| 45 | Ratio Architects | 5,537,316 |
| 46 | Leo A Daly | 5,395,356 |
| 47 | Bergmann Associates | 5,304,175 |
| 48 | Little | 5,249,190 |
| 49 | Hammel, Green and Abrahamson | 4,836,088 |
| 50 | Legat Architects | 4,685,600 |
| 51 | GBBN Architects | 4,560,000 |
| 52 | Carrier Johnson + Culture | 4,060,468 |
| 53 | Parkhill, Smith & Cooper | 4,026,000 |
| 54 | Cooper Carry | 3,961,244 |
| 55 | CTA Architects Engineers | 3,737,320 |
| 56 | Cambridge Seven Associates | 3,473,000 |
| 57 | PGAL | 3,260,300 |
| 58 | BLDD Architects | 3,000,000 |
| 59 | IBI Group ? Gruzen Samton | 3,000,000 |
| 60 | Kohn Pedersen Fox Associates | 2,974,000 |
| 61 | Slaterpaull Architects | 2,879,532 |
| 62 | Hord Coplan Macht | 2,843,072 |
| 63 | OZ Architecture | 2,825,000 |
| 64 | Kirksey | 2,822,225 |
| 65 | Rule Joy Trammell + Rubio | 2,801,380 |
| 66 | WDG Architecture | 2,757,000 |
| 67 | RS&H | 2,450,000 |
| 68 | SchenkelShultz Architecture | 2,386,000 |
| 69 | Payette | 2,282,352 |
| 70 | Corgan | 2,202,280 |
| 71 | Integrus Architecture | 2,191,762 |
| 72 | BLTa | 2,175,000 |
| 73 | H3 Hardy Collaboration Architecture | 2,141,323 |
| 74 | WHR Architects | 1,958,367 |
| 75 | Baskervill | 1,853,208 |
| 76 | Ashley McGraw Architects | 1,836,510 |
| 77 | KZF Design | 1,698,300 |
| 78 | Eppstein Uhen Architects | 1,691,787 |
| 79 | VOA Associates | 1,628,847 |
| 80 | GWWO | 1,623,501 |
| 81 | Wight & Company | 1,586,000 |
| 82 | Hoffmann Architects | 1,548,000 |
| 83 | Symmes Maini & McKee Associates | 1,530,000 |
| 84 | PBK | 1,500,000 |
| 85 | NAC|Architecture | 1,424,431 |
| 86 | LaBella Associates | 1,310,186 |
| 87 | Niles Bolton Associates | 1,263,210 |
| 88 | Nelson | 1,213,987 |
| 89 | Fentress Architects | 1,120,400 |
| 90 | Urban Design Group | 1,100,000 |
| 91 | Environetics | 1,087,370 |
| 92 | NORR | 1,052,484 |
| 93 | Becker Morgan Group | 1,037,159 |
| 94 | Albert Kahn Associates | 904,065 |
| 95 | RTKL Associates | 849,000 |
| 96 | Good Fulton & Farrell | 815,800 |
| 97 | Goettsch Partners | 810,000 |
| 98 | BBS Architects | 800,240 |
| 99 | Commonwealth Architects | 775,074 |
| 100 | Francis Cauffman | 707,774 |
| 101 | RNL | 690,000 |
| 102 | RBB Architects | 657,149 |
| 103 | RSP Architects | 620,000 |
| 104 | Gresham, Smith and Partners | 567,000 |
| 105 | Fanning/Howey Associates | 541,000 |
| 106 | Rosser International | 539,460 |
| 107 | Harvard Jolly Architecture | 530,103 |
| 108 | DesignGroup | 457,970 |
| 109 | Hnedak Bobo Group | 353,000 |
| 110 | JRS Architect | 295,000 |
| 111 | Emersion Design | 273,766 |
| 112 | Ware Malcomb | 240,000 |
| 113 | H+L Architecture | 236,252 |
| 114 | Smallwood, Reynolds, Stewart, Stewart & Associates | 226,716 |
| 115 | Sherlock, Smith & Adams | 219,000 |
Top University Sector Engineering Firms
| Rank | Company | 2013 Higher Ed Revenue |
| 1 | AECOM Technology Corp. | $76,410,000 |
| 2 | Jacobs | 35,150,000 |
| 3 | URS Corp. | 29,434,668 |
| 4 | Vanderweil Engineers | 26,614,500 |
| 5 | Burns & McDonnell | 24,152,332 |
| 6 | Affiliated Engineers | 22,469,000 |
| 7 | Parsons Brinckerhoff | 20,057,993 |
| 8 | STV | 18,416,000 |
| 9 | Arup | 14,561,909 |
| 10 | KJWW Engineering Consultants | 13,071,767 |
| 11 | BR+A Consulting Engineers | 10,120,000 |
| 12 | WSP Group | 9,120,000 |
| 13 | Simpson Gumpertz & Heger | 9,070,000 |
| 14 | Thornton Tomasetti | 7,942,631 |
| 15 | M-E Engineers | 7,243,000 |
| 16 | P2S Engineering | 7,170,208 |
| 17 | Shive-Hattery | 6,612,598 |
| 18 | Wiss, Janney, Elstner Associates | 6,550,000 |
| 19 | Dewberry | 6,331,593 |
| 20 | Environmental Systems Design | 6,144,227 |
| 21 | RMF Engineering | 5,400,000 |
| 22 | AKF Group | 5,261,000 |
| 23 | Glumac | 4,922,565 |
| 24 | M/E Engineering | 4,699,367 |
| 25 | TTG | 4,600,100 |
| 26 | Newcomb & Boyd | 4,505,166 |
| 27 | RDK Engineers | 4,490,000 |
| 28 | Heapy Engineering | 4,426,631 |
| 29 | KCI Technologies | 4,400,000 |
| 30 | Interface Engineering | 4,351,590 |
| 31 | Joseph R. Loring & Associates | 4,100,000 |
| 32 | I. C. Thomasson Associates | 3,500,000 |
| 33 | Spectrum Engineers | 3,347,542 |
| 34 | Highland Associates | 3,200,000 |
| 35 | KPFF Consulting Engineers | 3,125,000 |
| 36 | Syska Hennessy Group | 3,072,512 |
| 37 | Ross & Baruzzini | 3,043,445 |
| 38 | H.F. Lenz | 2,878,115 |
| 39 | Rist-Frost-Shumway Engineering | 2,850,000 |
| 40 | Sparling | 2,553,080 |
| 41 | Smith Seckman Reid | 2,519,005 |
| 42 | Martin/Martin | 2,263,812 |
| 43 | Karpinski Engineering | 2,170,197 |
| 44 | Aon Fire Protection Engineering Corp. | 2,000,000 |
| 45 | Fishbeck, Thompson, Carr & Huber | 2,000,000 |
| 46 | SSOE Group | 1,912,012 |
| 47 | Henderson Engineers | 1,838,909 |
| 48 | TLC Engineering for Architecture | 1,806,782 |
| 49 | Zak Companies | 1,706,697 |
| 50 | Bridgers & Paxton Consulting Engineers | 1,686,953 |
| 51 | CJL Engineering | 1,657,350 |
| 52 | Graef | 1,584,321 |
| 53 | Primera Engineers | 1,456,000 |
| 54 | CCRD Partners | 1,388,000 |
| 55 | Brinjac Engineering | 1,303,855 |
| 56 | Paulus, Sokolowski and Sartor | 1,200,000 |
| 57 | Wallace Engineering | 1,133,000 |
| 58 | Stanley Consultants | 1,090,529 |
| 59 | Leidos | 1,040,000 |
| 60 | Walter P Moore and Associates | 1,005,161 |
| 61 | Allen & Shariff | 1,000,000 |
| 62 | Dunham Associates | 950,000 |
| 63 | Bala Consulting Engineers | 926,000 |
| 64 | Degenkolb Engineers | 855,093 |
| 65 | OLA Consulting Engineers | 840,000 |
| 66 | Mazzetti | 774,981 |
| 67 | DeSimone Consulting Engineers | 474,096 |
| 68 | KLH Engineers | 468,745 |
| 69 | ThermalTech Engineering | 460,000 |
| 70 | French & Parrello Associates | 300,690 |
| 71 | GHT Limited | 260,000 |
| 72 | Wick Fisher White | 223,276 |
| 73 | CTLGroup | 220,000 |
| 74 | Davis, Bowen & Friedel | 204,422 |
| 75 | Barge Waggoner Sumner & Cannon | 200,000 |
| 76 | Magnusson Klemencic Associates | 166,730 |
| 77 | Coffman Engineers | 116,263 |
Top University Sector Construction Firms
| Rank | Company | 2013 Higher Ed Revenue |
| 1 | Whiting-Turner Contracting Co., The | $818,698,552 |
| 2 | Turner Construction | 774,984,000 |
| 3 | Gilbane | 475,524,757 |
| 4 | Skanska USA | 371,024,162 |
| 5 | PCL Construction | 368,990,947 |
| 6 | Clark Group | 312,942,079 |
| 7 | Shawmut Design and Construction | 265,610,000 |
| 8 | Barton Malow | 264,908,516 |
| 9 | Structure Tone | 229,539,000 |
| 10 | Consigli Construction | 227,995,719 |
| 11 | Mortenson Construction | 220,320,000 |
| 12 | McCarthy Holdings | 203,600,000 |
| 13 | Sundt Construction | 185,867,366 |
| 14 | Holder Construction | 176,219,000 |
| 15 | Messer Construction | 172,997,147 |
| 16 | Balfour Beatty US | 171,519,250 |
| 17 | JE Dunn Construction | 164,791,311 |
| 18 | LeChase Construction Services | 164,000,000 |
| 19 | Walbridge | 163,500,000 |
| 20 | Power Construction | 159,000,000 |
| 21 | Beck Group, The | 157,055,739 |
| 22 | Suffolk Construction | 149,745,824 |
| 23 | Tutor Perini Corp. | 145,671,900 |
| 24 | DPR Construction | 140,724,634 |
| 25 | W. M. Jordan Company | 130,566,823 |
| 26 | C.W. Driver | 127,735,000 |
| 27 | Flintco | 113,500,000 |
| 28 | Walsh Group, The | 111,960,180 |
| 29 | Boldt Company, The | 107,802,444 |
| 30 | Brasfield & Gorrie | 107,242,213 |
| 31 | Juneau Construction | 97,432,186 |
| 32 | Manhattan Construction | 89,176,000 |
| 33 | Rodgers Builders | 88,744,572 |
| 34 | McGough | 82,000,000 |
| 35 | Summit Contracting Group | 80,286,141 |
| 36 | Choate Construction | 77,541,745 |
| 37 | Pepper Construction | 72,000,000 |
| 38 | Hathaway Dinwiddie Construction | 66,219,000 |
| 39 | Bernards | 66,000,000 |
| 40 | Hensel Phelps | 65,670,000 |
| 41 | O'Neil Industries/W.E. O'Neil | 65,552,134 |
| 42 | Kraus-Anderson Construction | 64,000,000 |
| 43 | Hunt Construction Group | 64,000,000 |
| 44 | B. L. Harbert International | 63,854,476 |
| 45 | Lend Lease | 56,720,000 |
| 46 | CORE Construction Group | 55,821,501 |
| 47 | Fortis Construction | 53,628,000 |
| 48 | Layton Construction | 52,600,000 |
| 49 | Paric Corp. | 50,000,000 |
| 50 | New South Construction | 47,702,000 |
| 51 | Hill & Wilkinson | 46,288,000 |
| 52 | Austin Commercial | 44,335,793 |
| 53 | Yates Companies, The | 42,800,000 |
| 54 | Bette Companies, The | 38,929,000 |
| 55 | Hoffman Construction | 37,000,000 |
| 56 | Coakley & Williams Construction | 32,064,969 |
| 57 | Adolfson & Peterson Construction | 30,713,572 |
| 58 | URS Corp. | 29,434,668 |
| 59 | James G. Davis Construction | 27,506,326 |
| 60 | Weitz Company, The | 26,478,980 |
| 61 | Bomel Construction | 24,949,344 |
| 62 | Linbeck Group | 24,410,000 |
| 63 | LPCiminelli | 23,426,935 |
| 64 | IMC Construction | 22,086,310 |
| 65 | Hill International | 22,000,000 |
| 66 | HITT Contracting | 20,900,000 |
| 67 | E.W. Howell | 20,566,000 |
| 68 | Parsons Brinckerhoff | 20,057,993 |
| 69 | STV | 18,416,000 |
| 70 | Stalco Construction | 17,780,000 |
| 71 | Haselden Construction | 17,425,677 |
| 72 | Kitchell Corp. | 13,043,551 |
| 73 | Hoar Construction | 12,920,000 |
| 74 | Batson-Cook | 12,513,549 |
| 75 | Absher Construction | 12,280,813 |
| 76 | S. M. Wilson & Co. | 10,863,488 |
| 77 | James McHugh Construction | 10,538,534 |
| 78 | Robins & Morton | 8,714,264 |
| 79 | Clune Construction | 8,635,947 |
| 80 | Haskell | 8,294,931 |
| 81 | Alberici Constructors | 7,380,631 |
| 82 | Heery International | 7,186,274 |
| 83 | Wight & Company | 4,935,000 |
| 84 | Gray Construction | 3,880,000 |
| 85 | Ryan Companies US | 3,715,948 |
| 86 | KBE Building Corp. | 2,694,826 |
| 87 | Leopardo Companies | 1,907,266 |
| 88 | Douglas Company, The | 1,507,502 |
| 89 | JLL | 1,375,045 |
| 90 | Astorino | 1,222,033 |
| 91 | Allen & Shariff | 1,000,000 |
Read BD+C's full 2014 Giants 300 Report
Related Stories

Products and Materials | Feb 14, 2022
How building owners and developers can get ahead of the next supply chain disaster
Global supply chain interruptions that started at the very beginning of the pandemic are still with us and compounding every step of the way. Below are a few proven tips on how to avert some of the costly fallout should we be faced with similar commercial disasters at any time in the future.

Urban Planning | Feb 14, 2022
5 steps to remake suburbs into green communities where people want to live, work, and play
Stantec's John Bachmann offers proven tactic for retrofitting communities for success in the post-COVID era.

Urban Planning | Feb 11, 2022
6 ways to breathe life into mixed-use spaces
To activate mixed-use spaces and realize their fullest potential, project teams should aim to create a sense of community and pay homage to the local history.
Senior Living Design | Feb 11, 2022
Design for senior living: A chat with Rocky Berg, AIA
Rob Cassidy, Editor of MULTIFAMILY Design + Construction, chats with Rocky Berg, AIA, Principal with Dallas architecture firm three, about how to design senior living communities to meet the needs of the owner, seniors, their families, and staff.
Architects | Feb 11, 2022
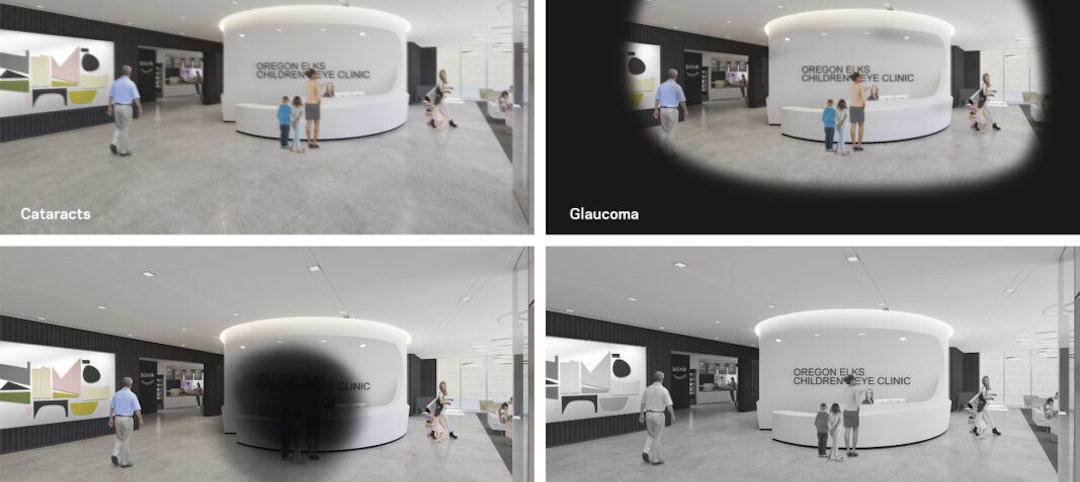
How computer simulations of vision loss create more empathetic buildings for the visually impaired
Here is a look at four challenges identified from our research and how the design responds accordingly.
Healthcare Facilities | Feb 10, 2022
Respite for the weary healthcare worker
The pandemic has shined a light on the severe occupational stress facing healthcare workers. Creating restorative hospital environments can ease their feelings of anxiety and burnout while improving their ability to care for patients.

Architects | Feb 8, 2022
Perkins Eastman and BLT Architects merge
Expanding services in hospitality, education, and mixed-use sectors to better serve clients.

Architects | Feb 3, 2022
SmithGroup elevates Mark Adams to lead workplace practice
In his new role, Adams leads the firm’s practice devoted to the design of corporate and commercial facilities.

Architects | Feb 2, 2022
Steven L. Pliam joins LEO A DALY as Design Technology Leader
Pliam will oversee the deployment and use of technologies such as computational design, parametric design, digital practice, reality capture, visualization, virtual/augmented reality, GIS and AI/Machine Learning.

Architects | Jan 31, 2022
Heatherwick Studio proposes new public waterfront site for Seoul
Heatherwick Studio was recently selected as part of the team by the Seoul Metropolitan Government to create a new sports and cultural district for the city.


