


Grumman/Butkus Associates, a firm of energy efficiency consultants and sustainable design engineers, recently released the results of its 2019 Hospital Energy and Water Benchmarking Survey, focusing on healthcare facilities’ resource usage trends and costs for calendar year 2018.
Since G/BA initiated the survey more than 20 years ago, hospitals’ overall fossil fuel use has trended downward, but electricity use isn’t declining as much. The average combined Btu/ft2 (electricity plus gas/steam) for participating facilities was 245,258 in this year’s survey, up from 241,733 in CY2017.
Square-foot prices for gas/steam fell modestly ($0.74 in 2918, compared with $0.75 in 2017), but square-foot prices for electricity climbed rose sharply ($2.57 in 2018, compared with $2.41 in 2017). The overall result is that hospitals’ total ft2 costs for energy (gas/steam plus electric) increased: $3.31 for 2018, compared with $3.16 for 2017.
Hospitals’ average carbon footprint has remained fairly steady at 50 to 60 pounds of CO2 equivalent per ft2 per year since G/BA began calculating carbon data in 1999. “If we are going to address the very daunting issue of climate change, the healthcare industry must make greater strides in reducing its carbon footprint,” says Dan Doyle, G/BA Chairman. “As the trend data shows, not enough progress is being made so far.”
Participating facilities displayed a broad range of usage patterns. For instance, some participants are using more than 250,000 BTU/ft2 in fossil fuel annually, compared with a general mid-range of facilities (about 140,000 BTU/ft2/year) and those that used least (75,000 BTU/ft2/year or less). Similarly, a few hospitals consume more than 45 kWh/ft2/year in electricity, compared with a mid-range of about 30 kWh/ft2/year. A few squeaked by with less than 18 kWh/ft2/year.
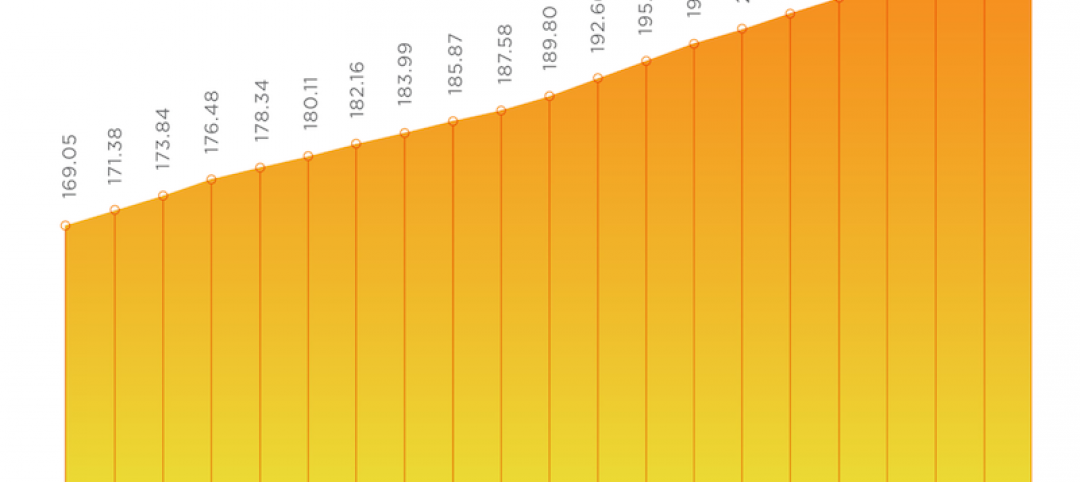
 Hospitals’ energy costs per square foot (red boxes) rose in 2018. Energy use intensity (Btu/sf/year, blue bars) has drifted downward over time but also ticked up in 2018. Chart ©2020 Grumman/Butkus Associates.
“Facilities that have high unit costs for energy should view this as an opportunity,” says Doyle. “For example, an energy conservation project that would have a five-year payback at an ‘average’ facility may have a payback of just 2.5 or 3 years at a facility with higher unit costs for energy.”
Hospital water/sewer use is also gradually declining, currently averaging about 48 gallons per square foot per year (compared with more than 60 gallons/ ft2/year a decade ago). Costs for water/sewer are generally rising, however, now averaging $0.44 /ft2. “G/BA expects the trend of rising water and sewer costs to continue,” says Doyle. “Price hikes not only reflect increasing costs to extract and treat the water, but also the fact that cash-strapped governmental entities may view water as a revenue source. Costs to upgrade or replace aging infrastructure are also contributing to escalating costs”
Since 1995, the G/BA survey has provided a free annual benchmarking resource. Hospitals are invited to participate by submitting responses to a short list of questions. Information for this edition was provided by 125 hospitals located in Illinois (48), Wisconsin (18), Indiana (16), Michigan (15), Texas (13), and several other states.
Full results and analysis, as well as information about participating in the 2020 survey (2019 data), are available at the firm’s website: grummanbutkus.com/HES. For additional information, contact Dan Doyle (ddoyle@grummanbutkus.com) or Julie Higginbotham (jhigginbotham@grummanbutkus.
Related Stories

Market Data | Jan 29, 2021
Multifamily housing construction outlook soars in late 2020
Exceeds pre-COVID levels, reaching highest mark since 1st quarter 2018.

Market Data | Jan 29, 2021
The U.S. hotel construction pipeline stands at 5,216 projects/650,222 rooms at year-end 2020
At the end of Q4 ‘20, projects currently under construction stand at 1,487 projects/199,700 rooms.

Multifamily Housing | Jan 27, 2021
2021 multifamily housing outlook: Dallas, Miami, D.C., will lead apartment completions
In its latest outlook report for the multifamily rental market, Yardi Matrix outlined several reasons for hope for a solid recovery for the multifamily housing sector in 2021, especially during the second half of the year.

Market Data | Jan 26, 2021
Construction employment in December trails pre-pandemic levels in 34 states
Texas and Vermont have worst February-December losses while Virginia and Alabama add the most.

Market Data | Jan 19, 2021
Architecture Billings continue to lose ground
The pace of decline during December accelerated from November.

Market Data | Jan 19, 2021
2021 construction forecast: Nonresidential building spending will drop 5.7%, bounce back in 2022
Healthcare and public safety are the only nonresidential construction sectors that will see growth in spending in 2021, according to AIA's 2021 Consensus Construction Forecast.

Market Data | Jan 13, 2021
Atlanta, Dallas seen as most favorable U.S. markets for commercial development in 2021, CBRE analysis finds
U.S. construction activity is expected to bounce back in 2021, after a slowdown in 2020 due to challenges brought by COVID-19.
Market Data | Jan 13, 2021
Nonres construction could be in for a long recovery period
Rider Levett Bucknall’s latest cost report singles out unemployment and infrastructure spending as barometers.

Market Data | Jan 13, 2021
Contractor optimism improves as ABC’s Construction Backlog inches up in December
ABC’s Construction Confidence Index readings for sales, profit margins, and staffing levels increased in December.

Market Data | Jan 11, 2021
Turner Construction Company launches SourceBlue Brand
SourceBlue draws upon 20 years of supply chain management experience in the construction industry.


