


After a 20% falloff in 2013, the global wind power industry made a strong comeback in 2014, with a record 51.2 gigawatts (GW) installed, representing a 42% increase over the previous year, according to the BTM Consult arm of Navigant Research in its latest World Wind Energy Market Update 2015.
China alone installed a record 23.2 GW of new wind power last year. All told, the global five-year average growth rate was 7.8%, and cumulative installed capacity rose to 373 GW by the end of last year
However, Navigant projects a curtailment in the growth of annual new installations through 2019. Over that forecast period, installations are expected to increase by only 0.3% per year, and that includes an 8.9% growth in 2015. A total of 245,547 megawatts of wind power will be added over the forecast period, increasing cumulative capacity by 13.2% per year.
China will continue to lead the world in installation activity for the foreseeable future. But Navigant doesn’t expect that country to add more than 17 GWs in any given year.
Navigant foresees a “substantial” drop in installations in Germany due to changes in incentive structures after 5.1 GW of wind power were installed last year, which was higher than anticipated.
 Chart from Navigant Research's wind power outlook
The U.S. wind power market has been recovering, thanks to the 2013 extension of the Production Tax Credit/Investment Tax Credit, as well as new safe-harbor guidance from the Internal Revenue Service about tax-credit eligibility. Navigant projects 14.8 GW will be installed in the U.S. in the years 2015 and 2016 combined.
In its 227-page report, Navigant notes that the average size of wind turbines increased only slightly in 2014, to 1,958 kilowatts (kW). The global market for direct-drive turbines grew 30% to 13,740 megawatts (MW), and represented 27% of all installations. In contrast, offshore wind grid connection and weather-related delays halved new offshore installations to 852 MWs in 2014.
Navigant notes that OEM sources are focusing more on product diversification, and are designed machines for maximum energy production in low wind speed areas, for operations in high altitudes or in cold climates, or for areas with blade-tip height restrictions. The evolution of larger rotor machines is leading to new blade designs, manufacturing processes, sourcing strategies, and supplier partnerships.
Interestingly, Navigant is seeing the hegemony of bigger players loosening a bit. Last year, the top 15 operator-owners controlled 29.3% of the market, or two percentage points lower than in 2013. “This exemplifies a trend of commercial acceptance in the utility marketplace. Demand for wind plants continues to move beyond the traditional owners that are historically comfortable with wind to new owners that are now convinced of the value wind plants bring to their portfolios,” Navigant reports.
Related Stories
Green | Aug 16, 2018
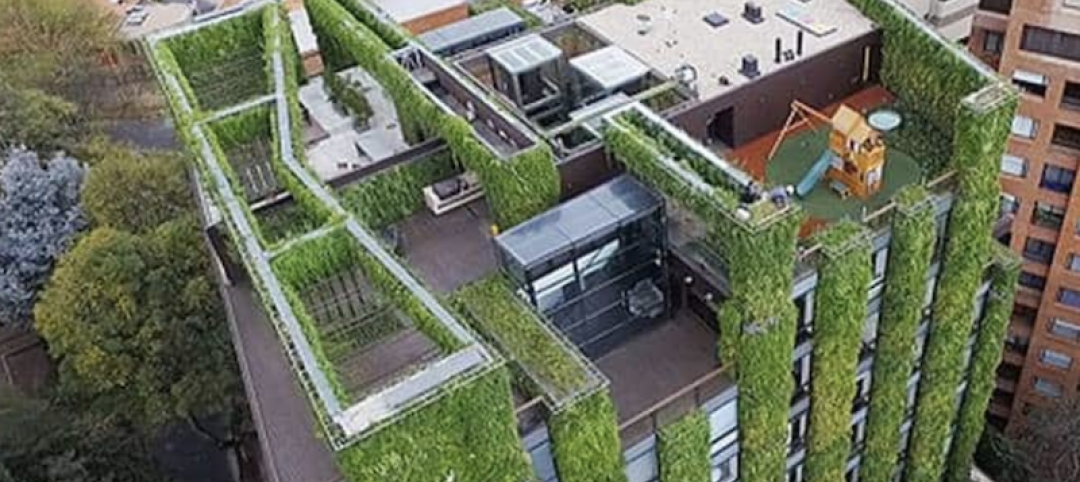
Vertical gardens: Wellness oases in the urban jungle
When there’s only so much real estate available in urban centers for parks, how’s a developer to bring in more green with biophilic design?

Green | Aug 15, 2018
What if your neighborhood could make you healthier?
The WELL Community Standard equips planners to build health promotion into the very fabric of neighborhoods.

Green | Jul 26, 2018
St. Paul aims for zero carbon in all buildings by 2050
The city is working for better efficiency and sourcing green power to reach its goal.

Green | Jul 26, 2018
DOE releases updated version of Better Buildings Financing Navigator
Version 2.0 provides renewable energy financing options, sector-specific and location-specific financing resources, and a smart database of financing providers.

Green | Jul 24, 2018
Cincinnati’s green approach to sewer discharge expected to save $100 million
Environmentally strategy does have its limits, though.

Codes and Standards | Jul 17, 2018
NIMBYism, generational divide threaten plan for net-zero village in St. Paul, Minn.
The ambitious redevelopment proposal for a former Ford automotive plant creates tension.

Sponsored | Energy Efficiency | Jul 2, 2018
Going solar has never been easier
There is an efficient system for mounting solar panels to roofs and turning roof real estate into raw power.

Multifamily Housing | Jun 27, 2018
To take on climate change, go passive
If you haven’t looked seriously at “passive house” design and construction, you should.

Accelerate Live! | Jun 24, 2018
Watch all 19 Accelerate Live! talks on demand
BD+C’s second annual Accelerate Live! AEC innovation conference (May 10, 2018, Chicago) featured talks on AI for construction scheduling, regenerative design, the micro-buildings movement, post-occupancy evaluation, predictive visual data analytics, digital fabrication, and more. Take in all 19 talks on demand.

Office Buildings | Jun 15, 2018
Portland’s newest office buildings put nature on center stage
Hacker Architects designed the space for Portland’s Frontside District.


