


Lodging Econometrics (LE) recently compiled construction pipeline counts for every country and market around the world. Their analysts state that the total global construction pipeline ascended to a record high of 14,051 projects/2,327,923 rooms, a 9% increase in projects and an 8% increase in rooms year-over-year (YOY). The report summarizes development in 176 countries worldwide.
With the exception of Latin America, all regions of the globe either continued to set record high pipeline counts or have already settled into topping-out formations amidst concerns of a worldwide economic slowdown. The fallout after the on-going trade dispute between the United States and China continues to be the leading contributor.
But, low-interest rates and accommodative lending terms are the primary catalysts behind pipeline growth as the global pipeline should continue to grow for the foreseeable future, albeit at a much slower pace.
There is a record high 6,565 projects currently under construction worldwide having 1,192,398 rooms. Projects scheduled to start construction in the next 12 months; peaking at an all-time high for both projects and rooms, stands at 4,392 projects/636,080 rooms. Projects in the early planning stage continue to grow, with a 6% increase in projects and 10% increase in rooms, YOY, standing at 3,094 and 499,445 respectively.
The top countries by project count are the United States with 5,653 projects/693,207 rooms, just 230 projects shy of its all-time high of 5,883 projects set in the second quarter of 2008, and China with a current pipeline of 2,991 projects/592,884 rooms, which is a new high. The U.S. accounts for 40% of projects in the total global construction pipeline while China has 21%, resulting in 61% of all global projects being concentrated in just these two countries. Distantly following are Indonesia with 378 projects/63,196 rooms, Germany with 320 projects/57,689 rooms, and the United Kingdom with 280 projects/40,970 rooms.
Around the world, the cities with the largest pipelines by project counts are Dubai with 173 projects/50,832 rooms, New York City with 166 projects/28,231 rooms, and Dallas, TX with 162 projects/19,972 rooms. Los Angeles, CA follows with 158 projects/25,428 rooms, and Houston, TX with 146 projects/14,998 rooms.
The leading franchise company in the global construction pipeline is Marriott International with 2,534 projects/420,562 rooms. Hilton Worldwide follows closely with 2,334 projects/340,626 rooms. Next is InterContinental Hotels Group (IHG) with 1,769 projects/259,057 rooms, and AccorHotels with 980 projects/175,002 rooms. These four company brands account for 54% of all projects in the pipeline.
Leading brands in the pipeline for each of these companies are IHG’s Holiday Inn Express with 737 projects/93,415 rooms, Hampton by Hilton with 689 projects/90,634 rooms, Marriott’s Fairfield Inn with 397 projects/43,451 rooms, and AccorHotel’s Ibis Brands with 387 projects/54,683 rooms.
The first half of 2019 saw a total of 1,374 new hotels/196,237 rooms open around the world with an additional 1,675 hotels/236,334 rooms scheduled to open by year-end. With the global pipeline being at an all-time high, LE forecasts that new hotel openings will continue to climb with 3,168 hotels expected to open in 2020. In 2021, new openings are forecast to reach 3,171 hotels. Should all hotels forecast to open by 2021 come to fruition, it will be the largest surge of new hotel openings, collectively around the world, that LE has ever recorded.
Related Stories

Contractors | Jul 13, 2023
Construction input prices remain unchanged in June, inflation slowing
Construction input prices remained unchanged in June compared to the previous month, according to an Associated Builders and Contractors analysis of U.S. Bureau of Labor Statistics Producer Price Index data released today. Nonresidential construction input prices were also unchanged for the month.

Contractors | Jul 11, 2023
The average U.S. contractor has 8.9 months worth of construction work in the pipeline, as of June 2023
Associated Builders and Contractors reported that its Construction Backlog Indicator remained unchanged at 8.9 months in June 2023, according to an ABC member survey conducted June 20 to July 5. The reading is unchanged from June 2022.

Market Data | Jul 5, 2023
Nonresidential construction spending decreased in May, its first drop in nearly a year
National nonresidential construction spending decreased 0.2% in May, according to an Associated Builders and Contractors analysis of data published today by the U.S. Census Bureau. On a seasonally adjusted annualized basis, nonresidential spending totaled $1.06 trillion.

Apartments | Jun 27, 2023
Average U.S. apartment rent reached all-time high in May, at $1,716
Multifamily rents continued to increase through the first half of 2023, despite challenges for the sector and continuing economic uncertainty. But job growth has remained robust and new households keep forming, creating apartment demand and ongoing rent growth. The average U.S. apartment rent reached an all-time high of $1,716 in May.

Industry Research | Jun 15, 2023
Exurbs and emerging suburbs having fastest population growth, says Cushman & Wakefield
Recently released county and metro-level population growth data by the U.S. Census Bureau shows that the fastest growing areas are found in exurbs and emerging suburbs.

Contractors | Jun 13, 2023
The average U.S. contractor has 8.9 months worth of construction work in the pipeline, as of May 2023
Associated Builders and Contractors reported that its Construction Backlog Indicator remained unchanged at 8.9 months in May, according to an ABC member survey conducted May 20 to June 7. The reading is 0.1 months lower than in May 2022. Backlog in the infrastructure category ticked up again and has now returned to May 2022 levels. On a regional basis, backlog increased in every region but the Northeast.
Industry Research | Jun 13, 2023
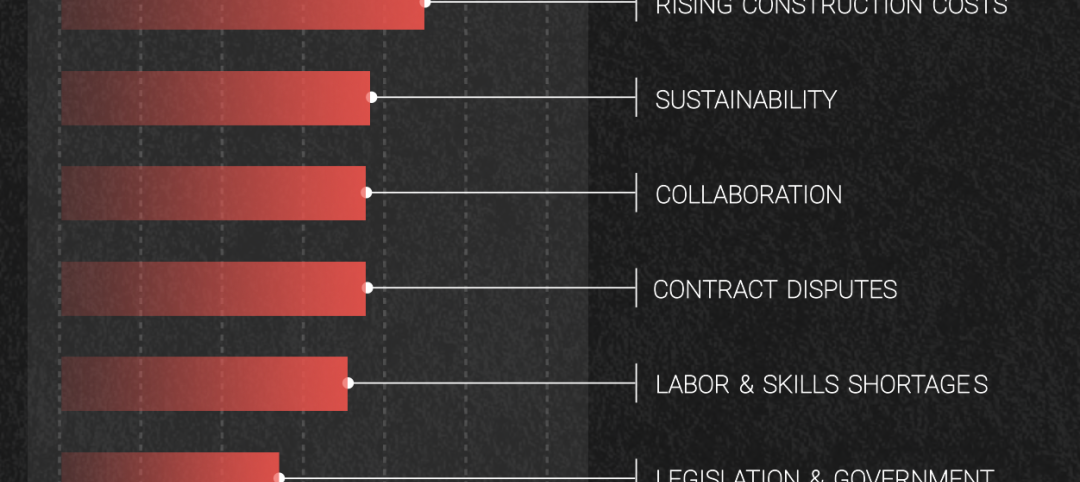
Two new surveys track how the construction industry, in the U.S. and globally, is navigating market disruption and volatility
The surveys, conducted by XYZ Reality and KPMG International, found greater willingness to embrace technology, workplace diversity, and ESG precepts.
| Jun 5, 2023
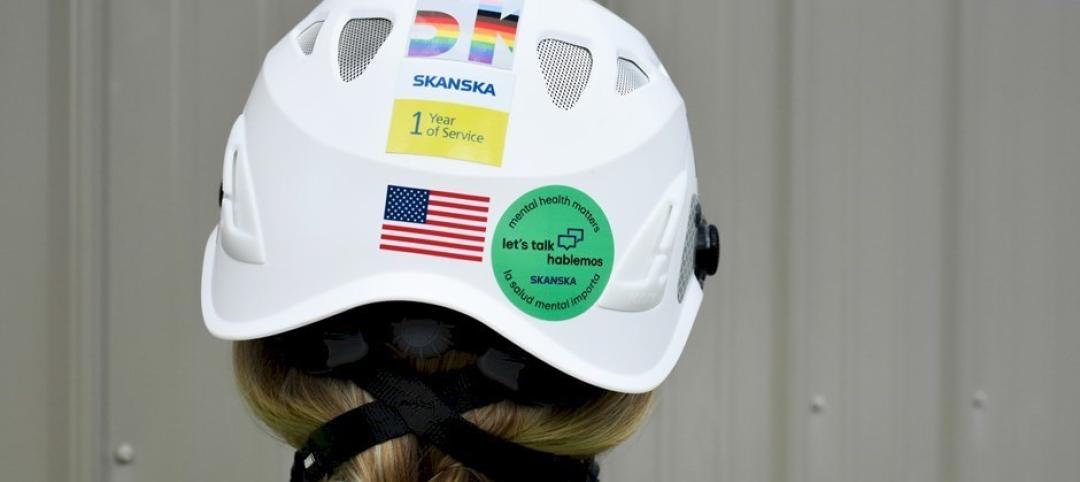
Communication is the key to AEC firms’ mental health programs and training
The core of recent awareness efforts—and their greatest challenge—is getting workers to come forward and share stories.

Contractors | May 24, 2023
The average U.S. contractor has 8.9 months worth of construction work in the pipeline, as of April 2023
Contractor backlogs climbed slightly in April, from a seven-month low the previous month, according to Associated Builders and Contractors.

Multifamily Housing | May 23, 2023
One out of three office buildings in largest U.S. cities are suitable for residential conversion
Roughly one in three office buildings in the largest U.S. cities are well suited to be converted to multifamily residential properties, according to a study by global real estate firm Avison Young. Some 6,206 buildings across 10 U.S. cities present viable opportunities for conversion to residential use.


