

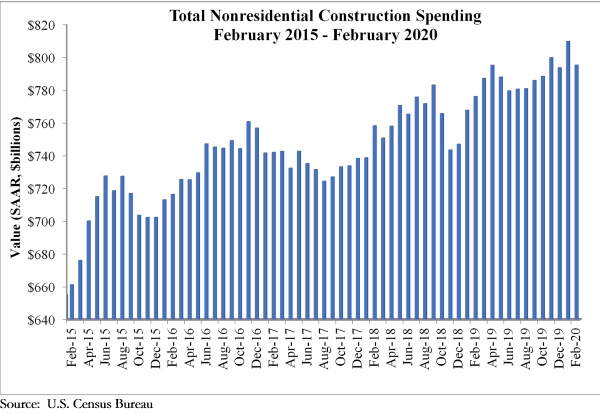
National nonresidential construction spending fell 1.8% in February, but is up 2.5% compared to the same time last year, according to an Associated Builders and Contractors analysis of data published today by the U.S. Census Bureau. On a seasonally adjusted annualized basis, spending totaled $795.1 billion for the month.
Private nonresidential spending declined 2% on a monthly basis and is down 0.7% compared to February 2019. Public nonresidential construction spending was down 1.5% for the month, but is up 7.2% on a year-over-year basis.
“Data characterizing the economy prior to the coronavirus outbreak continues to trickle in,” said ABC Chief Economist Anirban Basu. “While nonresidential construction spending declined in February, according to today’s data release, the decline was modest and overall performance was not substantially different from prior months.
“However, with communities in Massachusetts, Pennsylvania, California and elsewhere recently shutting down certain construction projects in an effort to better support social distancing and with economic activity generally grinding toward a halt, the construction spending data will undoubtedly deteriorate further and faster during the months to come,” said Basu. “Unfortunately, that is not where the pain will end. Once the crisis is over, hotel chains will be weaker financially, more storefronts will be empty and fewer employers will be interested in relocating to high-end office space, which will result in diminished demand for nonresidential construction services even after the broader economy comes back to life.
“Typically, nonresidential construction holds up better during the early stages of a downturn as contractors continue to work through their collective backlog, which stood at 8.9 months in January 2020, according to ABC’s Construction Backlog Indicator,” said Basu. “That may still be the case, but, given growing liquidity and solvency problems spreading through the economy, it is quite likely that many construction projects presently on the drawing board will be postponed or canceled. Backlog may disappear quickly as project owners resort to the use of force majeure clauses or other mechanisms to back out of contractual obligations. Time will tell, and eventually the extent to which projects are delayed will be reflected in the construction spending data.”


Related Stories

Engineers | May 3, 2017
At first buoyed by Trump election, U.S. engineers now less optimistic about markets, new survey shows
The first quarter 2017 (Q1/17) of ACEC’s Engineering Business Index (EBI) dipped slightly (0.5 points) to 66.0.

Market Data | May 2, 2017
Nonresidential Spending loses steam after strong start to year
Spending in the segment totaled $708.6 billion on a seasonally adjusted, annualized basis.

Market Data | May 1, 2017
Nonresidential Fixed Investment surges despite sluggish economic in first quarter
Real gross domestic product (GDP) expanded 0.7 percent on a seasonally adjusted annualized rate during the first three months of the year.

Industry Research | Apr 28, 2017
A/E Industry lacks planning, but still spending large on hiring
The average 200-person A/E Firm is spending $200,000 on hiring, and not budgeting at all.

Market Data | Apr 19, 2017
Architecture Billings Index continues to strengthen
Balanced growth results in billings gains in all regions.

Market Data | Apr 13, 2017
2016’s top 10 states for commercial development
Three new states creep into the top 10 while first and second place remain unchanged.

Market Data | Apr 6, 2017
Architecture marketing: 5 tools to measure success
We’ve identified five architecture marketing tools that will help your firm evaluate if it’s on the track to more leads, higher growth, and broader brand visibility.

Market Data | Apr 3, 2017
Public nonresidential construction spending rebounds; overall spending unchanged in February
The segment totaled $701.9 billion on a seasonally adjusted annualized rate for the month, marking the seventh consecutive month in which nonresidential spending sat above the $700 billion threshold.

Market Data | Mar 29, 2017
Contractor confidence ends 2016 down but still in positive territory
Although all three diffusion indices in the survey fell by more than five points they remain well above the threshold of 50, which signals that construction activity will continue to be one of the few significant drivers of economic growth.

Market Data | Mar 24, 2017
These are the most and least innovative states for 2017
Connecticut, Virginia, and Maryland are all in the top 10 most innovative states, but none of them were able to claim the number one spot.


