

Is the construction industry in recovery or transition?
That’s the question raised by Rider Levett Bucknall’s North America Quarterly Construction Cost report for the second quarter of 2021.
On the positive side, the major economic indicators showed no signs for concern. Inflation in the first quarter of 2021 rose 1.7% over the previous quarter. The Gross Domestic Project increased by 6.4% in the first quarter of 2021 compared to the same period a year ago. And the index for Architectural Billings, at 55.6 in March, was above the 50 mark for the first time since Q4 2019. (It rose again in April, to 57.9.)
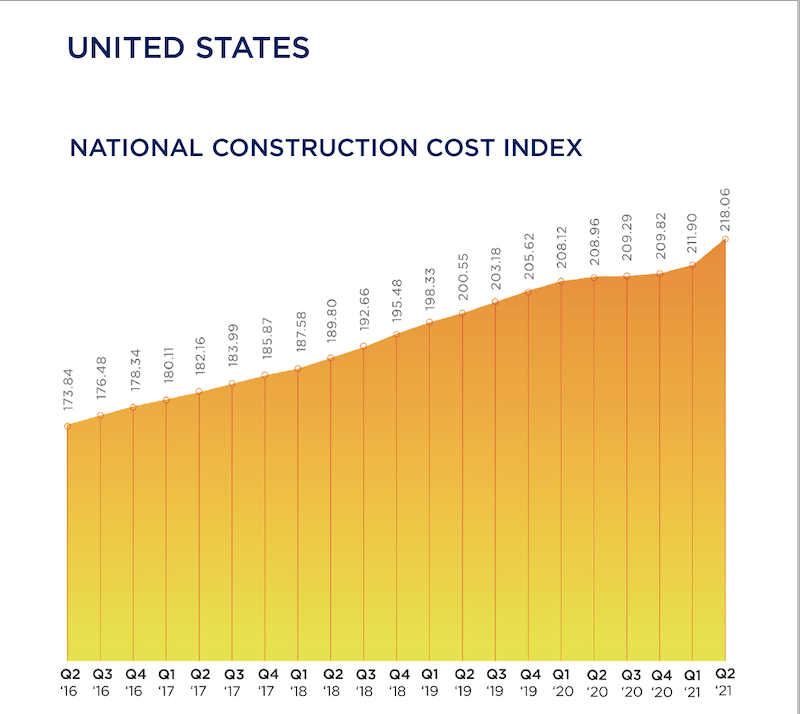
RLB’s Construction Cost Index, at 218.06 for the first quarter of 2021, was 4.6% above the same quarter in 2020. And construction in place in April, as valued by the U.S. Commerce Department, stood at $1.524 trillion, 9.8% higher than in April 2020.
On the glass-half-empty side, the construction industry is still hampered by supply-chain bottlenecks, volatile commodity prices, delayed permitting processes and materials tariffs. The ongoing shortage of qualified labor—construction unemployment, while down in the first quarter, was still 8.6%—is also having an impact on projects’ cost and scheduling, making budgeting and bidding “highly uncertain,” says RLB’s report.
The immediate future isn’t all that clear, either, what with the possibility of climbing interest rates, and the Biden Administration’s prioritizing clean energy and reduced carbon levels in response to climate change, which might also affect construction prices.
SEVERAL METROS EXCEED NATIONAL COST GROWTH AVERAGES
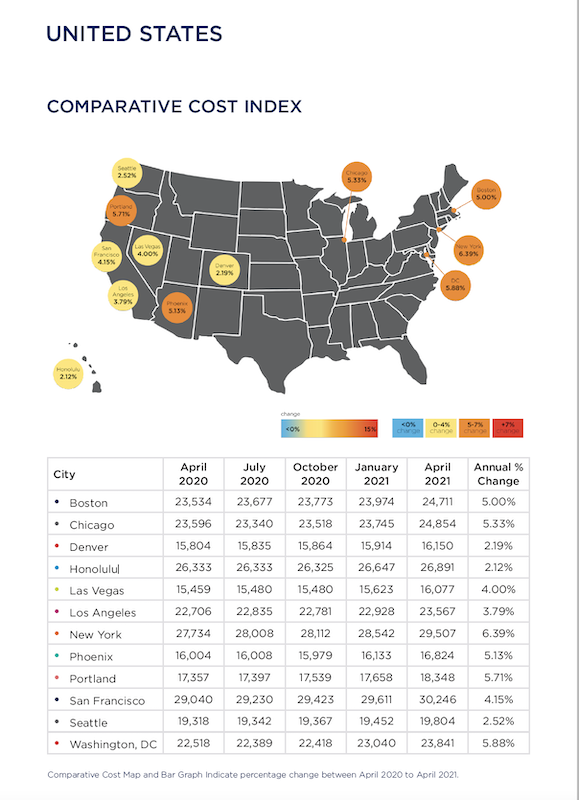
Construction spending was on the rise in all the metros that RLB tracked, several at rates higher than the 4.35% national average for the first quarter.
A closer look at construction costs per square foot found that San Francisco or Honolulu led the pack for hotels, industrial buildings, parking, five-star hotels, residential housing, and elementary education. New York outpaced other cities for new retail, high schools, and universities.
Boston, Chicago, New York, Phoenix, Portland, and Washington, D.C. all experienced percentage increases in construction costs above the 4.35% quarterly national average during Q1 2021 versus the same quarter a year ago. Other locations below the national average included Denver, Honolulu, Los Angeles, San Francisco, and Seattle. Las Vegas experienced the same escalation as the national average.
RLB thinks the most critical choices that GCs and CMs now face is identifying which building sectors to target while operating in a business environment that’s been altered by the coronavirus pandemic. For example, in the first quarter, the industrial sector grew by 12%, year-over-year; conversely hotels and hospitality projects contracted by 9%.
“One of the lessons learned from the past year is the central—and growing—role that technology plays in the AEC industries,” wrote Julian Anderson, FRICS, President of Rider Levett Bucknall North America. “The degree of operational efficiency that connected technologies affords is a true game changer, providing transparency, accuracy, and consistency to all stakeholders while accelerating the design process. From cost estimating to streamlining workflows to digital twins, these tools are transforming the landscape of design and construction.”
Related Stories

Engineers | May 3, 2017
At first buoyed by Trump election, U.S. engineers now less optimistic about markets, new survey shows
The first quarter 2017 (Q1/17) of ACEC’s Engineering Business Index (EBI) dipped slightly (0.5 points) to 66.0.

Market Data | May 2, 2017
Nonresidential Spending loses steam after strong start to year
Spending in the segment totaled $708.6 billion on a seasonally adjusted, annualized basis.

Market Data | May 1, 2017
Nonresidential Fixed Investment surges despite sluggish economic in first quarter
Real gross domestic product (GDP) expanded 0.7 percent on a seasonally adjusted annualized rate during the first three months of the year.

Industry Research | Apr 28, 2017
A/E Industry lacks planning, but still spending large on hiring
The average 200-person A/E Firm is spending $200,000 on hiring, and not budgeting at all.

Market Data | Apr 19, 2017
Architecture Billings Index continues to strengthen
Balanced growth results in billings gains in all regions.

Market Data | Apr 13, 2017
2016’s top 10 states for commercial development
Three new states creep into the top 10 while first and second place remain unchanged.

Market Data | Apr 6, 2017
Architecture marketing: 5 tools to measure success
We’ve identified five architecture marketing tools that will help your firm evaluate if it’s on the track to more leads, higher growth, and broader brand visibility.

Market Data | Apr 3, 2017
Public nonresidential construction spending rebounds; overall spending unchanged in February
The segment totaled $701.9 billion on a seasonally adjusted annualized rate for the month, marking the seventh consecutive month in which nonresidential spending sat above the $700 billion threshold.

Market Data | Mar 29, 2017
Contractor confidence ends 2016 down but still in positive territory
Although all three diffusion indices in the survey fell by more than five points they remain well above the threshold of 50, which signals that construction activity will continue to be one of the few significant drivers of economic growth.

Market Data | Mar 24, 2017
These are the most and least innovative states for 2017
Connecticut, Virginia, and Maryland are all in the top 10 most innovative states, but none of them were able to claim the number one spot.


