

Is the construction industry in recovery or transition?
That’s the question raised by Rider Levett Bucknall’s North America Quarterly Construction Cost report for the second quarter of 2021.
On the positive side, the major economic indicators showed no signs for concern. Inflation in the first quarter of 2021 rose 1.7% over the previous quarter. The Gross Domestic Project increased by 6.4% in the first quarter of 2021 compared to the same period a year ago. And the index for Architectural Billings, at 55.6 in March, was above the 50 mark for the first time since Q4 2019. (It rose again in April, to 57.9.)
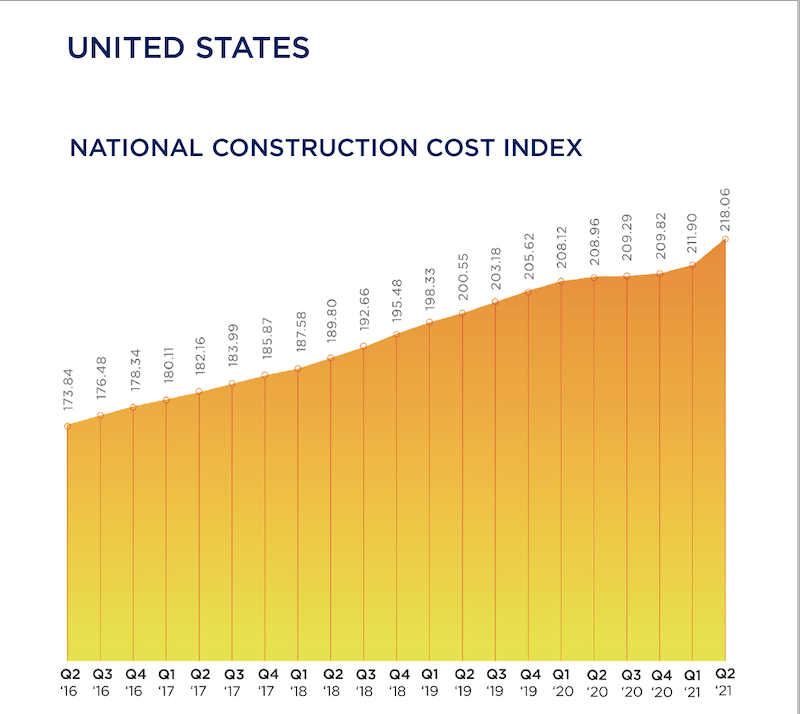
RLB’s Construction Cost Index, at 218.06 for the first quarter of 2021, was 4.6% above the same quarter in 2020. And construction in place in April, as valued by the U.S. Commerce Department, stood at $1.524 trillion, 9.8% higher than in April 2020.
On the glass-half-empty side, the construction industry is still hampered by supply-chain bottlenecks, volatile commodity prices, delayed permitting processes and materials tariffs. The ongoing shortage of qualified labor—construction unemployment, while down in the first quarter, was still 8.6%—is also having an impact on projects’ cost and scheduling, making budgeting and bidding “highly uncertain,” says RLB’s report.
The immediate future isn’t all that clear, either, what with the possibility of climbing interest rates, and the Biden Administration’s prioritizing clean energy and reduced carbon levels in response to climate change, which might also affect construction prices.
SEVERAL METROS EXCEED NATIONAL COST GROWTH AVERAGES
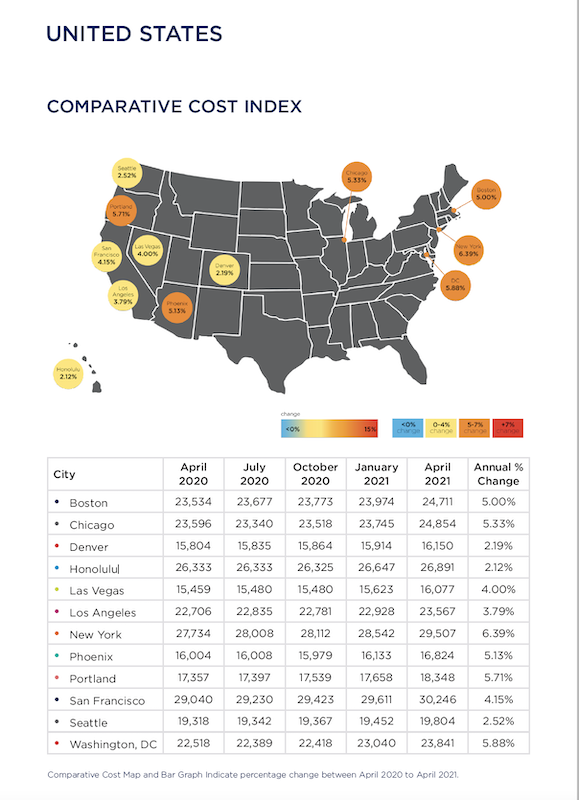
Construction spending was on the rise in all the metros that RLB tracked, several at rates higher than the 4.35% national average for the first quarter.
A closer look at construction costs per square foot found that San Francisco or Honolulu led the pack for hotels, industrial buildings, parking, five-star hotels, residential housing, and elementary education. New York outpaced other cities for new retail, high schools, and universities.
Boston, Chicago, New York, Phoenix, Portland, and Washington, D.C. all experienced percentage increases in construction costs above the 4.35% quarterly national average during Q1 2021 versus the same quarter a year ago. Other locations below the national average included Denver, Honolulu, Los Angeles, San Francisco, and Seattle. Las Vegas experienced the same escalation as the national average.
RLB thinks the most critical choices that GCs and CMs now face is identifying which building sectors to target while operating in a business environment that’s been altered by the coronavirus pandemic. For example, in the first quarter, the industrial sector grew by 12%, year-over-year; conversely hotels and hospitality projects contracted by 9%.
“One of the lessons learned from the past year is the central—and growing—role that technology plays in the AEC industries,” wrote Julian Anderson, FRICS, President of Rider Levett Bucknall North America. “The degree of operational efficiency that connected technologies affords is a true game changer, providing transparency, accuracy, and consistency to all stakeholders while accelerating the design process. From cost estimating to streamlining workflows to digital twins, these tools are transforming the landscape of design and construction.”
Related Stories

Market Data | May 23, 2018
Architecture firm billings strengthen in April
Firms report solid growth for seven straight months.

Market Data | May 22, 2018
Vacancies stable, rents rising, and pipeline receding, according to Transwestern’s 1Q US Office Market report
The Big Apple still leads the new construction charge.

Market Data | May 18, 2018
Construction employment rises in 38 states and D.C. from April 2017 to April 2018
California & West Virginia have biggest annual job gains, North Dakota has largest decline; California & Louisiana have largest monthly pickup, Indiana & North Dakota lead monthly drops.

High-rise Construction | May 18, 2018
The 100 tallest buildings ever conventionally demolished
The list comes from a recent CTBUH study.

Resiliency | May 17, 2018
Architects brief lawmakers and policy-makers on disaster recovery as hurricane season approaches
Urge senate passage of disaster recovery reform act; Relationship-building with local communities.

Market Data | May 17, 2018
These 25 cities have the highest urban infill development potential
The results stem from a COMMERCIALCafé study.

Market Data | May 10, 2018
Construction costs surge in April as new tariffs and other trade measures lead to significant increases in materials prices
Association officials warn that the new tariffs and resulting price spikes have the potential to undermine benefits of tax and regulatory reform, urge administration to reconsider.

Market Data | May 7, 2018
Construction employers add 17,000 jobs in April and 257,000 for the year
Unemployment rate for construction increases slightly compared to year earlier as higher pay levels appears to be attracting people with recent construction experience back into the workforce.

Market Data | May 2, 2018
Construction employment increases in 245 metro areas between March 2017 & 2018, as trade fights & infrastructure funding shortfalls loom
Houston-The Woodlands-Sugar Land, Texas and Weirton-Steubenville, W.Va.-Ohio experience largest year-over-year gains; Baton Rouge, La. and Auburn-Opelika, Ala. have biggest annual declines.

Market Data | May 2, 2018
Nonresidential Construction down in March, private sector falters, public sector unchanged
February’s spending estimate was revised roughly $10 billion higher.


