

Is the construction industry in recovery or transition?
That’s the question raised by Rider Levett Bucknall’s North America Quarterly Construction Cost report for the second quarter of 2021.
On the positive side, the major economic indicators showed no signs for concern. Inflation in the first quarter of 2021 rose 1.7% over the previous quarter. The Gross Domestic Project increased by 6.4% in the first quarter of 2021 compared to the same period a year ago. And the index for Architectural Billings, at 55.6 in March, was above the 50 mark for the first time since Q4 2019. (It rose again in April, to 57.9.)
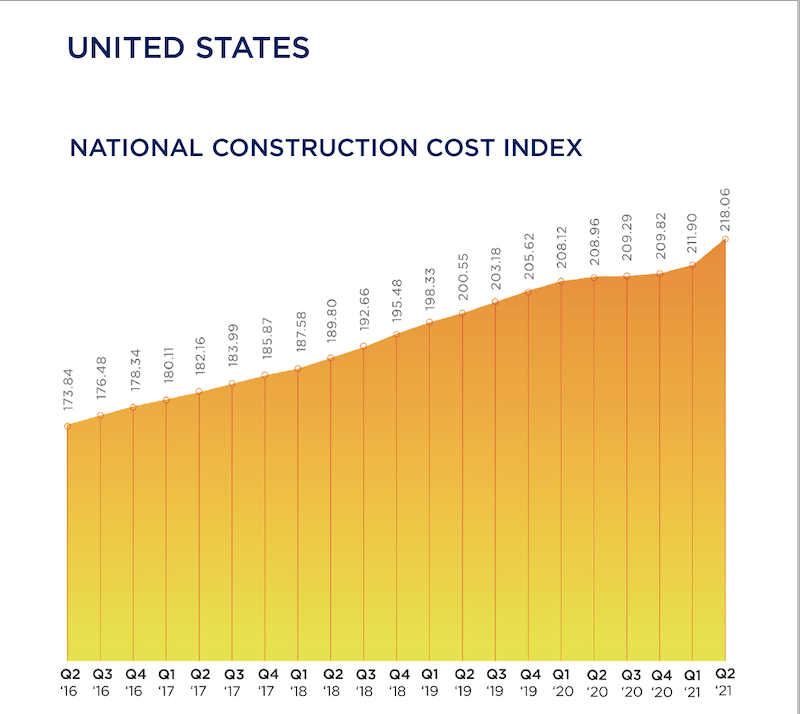
RLB’s Construction Cost Index, at 218.06 for the first quarter of 2021, was 4.6% above the same quarter in 2020. And construction in place in April, as valued by the U.S. Commerce Department, stood at $1.524 trillion, 9.8% higher than in April 2020.
On the glass-half-empty side, the construction industry is still hampered by supply-chain bottlenecks, volatile commodity prices, delayed permitting processes and materials tariffs. The ongoing shortage of qualified labor—construction unemployment, while down in the first quarter, was still 8.6%—is also having an impact on projects’ cost and scheduling, making budgeting and bidding “highly uncertain,” says RLB’s report.
The immediate future isn’t all that clear, either, what with the possibility of climbing interest rates, and the Biden Administration’s prioritizing clean energy and reduced carbon levels in response to climate change, which might also affect construction prices.
SEVERAL METROS EXCEED NATIONAL COST GROWTH AVERAGES
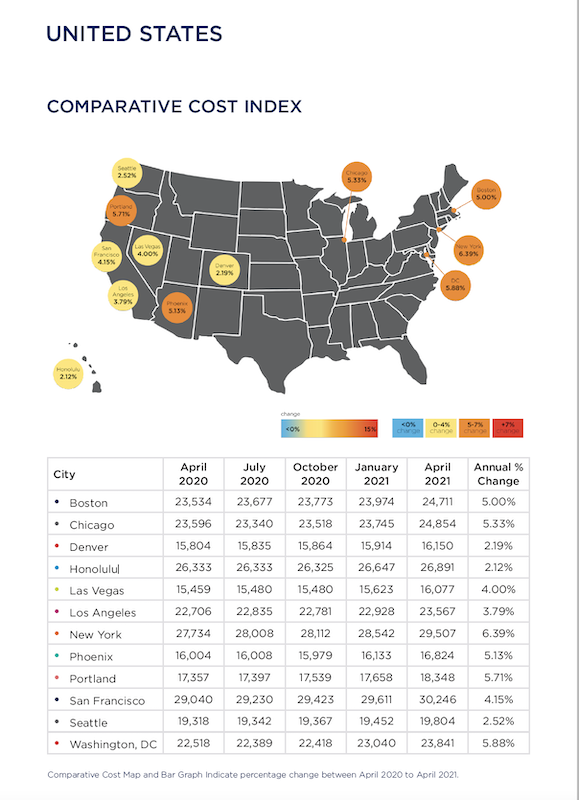
Construction spending was on the rise in all the metros that RLB tracked, several at rates higher than the 4.35% national average for the first quarter.
A closer look at construction costs per square foot found that San Francisco or Honolulu led the pack for hotels, industrial buildings, parking, five-star hotels, residential housing, and elementary education. New York outpaced other cities for new retail, high schools, and universities.
Boston, Chicago, New York, Phoenix, Portland, and Washington, D.C. all experienced percentage increases in construction costs above the 4.35% quarterly national average during Q1 2021 versus the same quarter a year ago. Other locations below the national average included Denver, Honolulu, Los Angeles, San Francisco, and Seattle. Las Vegas experienced the same escalation as the national average.
RLB thinks the most critical choices that GCs and CMs now face is identifying which building sectors to target while operating in a business environment that’s been altered by the coronavirus pandemic. For example, in the first quarter, the industrial sector grew by 12%, year-over-year; conversely hotels and hospitality projects contracted by 9%.
“One of the lessons learned from the past year is the central—and growing—role that technology plays in the AEC industries,” wrote Julian Anderson, FRICS, President of Rider Levett Bucknall North America. “The degree of operational efficiency that connected technologies affords is a true game changer, providing transparency, accuracy, and consistency to all stakeholders while accelerating the design process. From cost estimating to streamlining workflows to digital twins, these tools are transforming the landscape of design and construction.”
Related Stories

Market Data | Mar 7, 2023
AEC employees are staying with firms that invest in their brand
Hinge Marketing’s latest survey explores workers’ reasons for leaving, and offers strategies to keep them in the fold.

Multifamily Housing | Feb 21, 2023
Multifamily housing investors favoring properties in the Sun Belt
Multifamily housing investors are gravitating toward Sun Belt markets with strong job and population growth, according to new research from Yardi Matrix. Despite a sharp second-half slowdown, last year’s nationwide $187 billion transaction volume was the second-highest annual total ever.

Contractors | Feb 14, 2023
The average U.S. contractor has nine months worth of construction work in the pipeline
Associated Builders and Contractors reports today that its Construction Backlog Indicator declined 0.2 months to 9.0 in January, according to an ABC member survey conducted Jan. 20 to Feb. 3. The reading is 1.0 month higher than in January 2022.

Office Buildings | Feb 9, 2023
Post-Covid Manhattan office market rebound gaining momentum
Office workers in Manhattan continue to return to their workplaces in sufficient numbers for many of their employers to maintain or expand their footprint in the city, according to a survey of more than 140 major Manhattan office employers conducted in January by The Partnership for New York City.

Giants 400 | Feb 9, 2023
New Giants 400 download: Get the complete at-a-glance 2022 Giants 400 rankings in Excel
See how your architecture, engineering, or construction firm stacks up against the nation's AEC Giants. For more than 45 years, the editors of Building Design+Construction have surveyed the largest AEC firms in the U.S./Canada to create the annual Giants 400 report. This year, a record 519 firms participated in the Giants 400 report. The final report includes 137 rankings across 25 building sectors and specialty categories.

Multifamily Housing | Feb 7, 2023
Multifamily housing rents flat in January, developers remain optimistic
Multifamily rents were flat in January 2023 as a strong jobs report indicated that fears of a significant economic recession may be overblown. U.S. asking rents averaged $1,701, unchanged from the prior month, according to the latest Yardi Matrix National Multifamily Report.

Market Data | Feb 6, 2023
Nonresidential construction spending dips 0.5% in December 2022
National nonresidential construction spending decreased by 0.5% in December, according to an Associated Builders and Contractors analysis of data published today by the U.S. Census Bureau. On a seasonally adjusted annualized basis, nonresidential spending totaled $943.5 billion for the month.

Architects | Jan 23, 2023
PSMJ report: The fed’s wrecking ball is hitting the private construction sector
Inflation may be starting to show some signs of cooling, but the Fed isn’t backing down anytime soon and the impact is becoming more noticeable in the architecture, engineering, and construction (A/E/C) space. The overall A/E/C outlook continues a downward trend and this is driven largely by the freefall happening in key private-sector markets.

Hotel Facilities | Jan 23, 2023
U.S. hotel construction pipeline up 14% to close out 2022
At the end of 2022’s fourth quarter, the U.S. construction pipeline was up 14% by projects and 12% by rooms year-over-year, according to Lodging Econometrics.

Products and Materials | Jan 18, 2023
Is inflation easing? Construction input prices drop 2.7% in December 2022
Softwood lumber and steel mill products saw the biggest decline among building construction materials, according to the latest U.S. Bureau of Labor Statistics’ Producer Price Index.


