


Today, more than half of the world lives in an urban area. By 2050, this number is expected to increase to some two-thirds of the world’s population, according to the United Nations. While this may lead to overcrowding in cities, and overuse of resources, it also presents companies in the construction industry with major opportunities for growth.
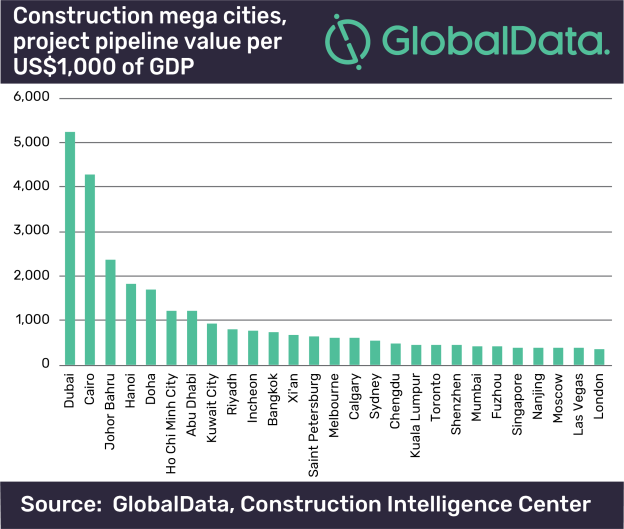
GlobalData tracks large-scale construction projects in all sectors, and following a recent assessment of project pipelines in major cities worldwide, it has compiled a listing of 50 “Construction Mega Cities” for 2019, each having a pipeline of projects with an investment value above US$30bn. The combined value of the project pipelines in these cities stands at US$5.3 trillion, and includes over 8,200 projects at various stages of development, from announced to execution.
From 2007 to 2025, GlobalData expects the cities’ combined gross domestic product (GDP) to increase by more than US$8 trillion to US$20.4 trillion. They will be home to an estimated 527 million inhabitants, many being in China and other emerging markets that are witnessing a fast pace of urbanization. GlobalData projects that average per capita GDP in these cities will rise from US$1,791 in 2007 to US$2,263 in 2025, in real terms.
Dubai remains at the top of the list of ‘Construction Mega Cities’, with total project values amounting to US$611.2bn, ahead of London in second place (US$342.9bn) and New York in third (US$285.2bn), while Moscow slipped to fifth place (US$201.4bn) when compared to the 2018 rankings. Seven new cities have made it to the 2019 list, namely Istanbul, Tokyo, Fuzhou, Zurich, Atlanta, Zhengzhou and Las Vegas. The combined value of the project pipelines for those new entrants stand at US$379.75bn, and includes 505 projects at various stages of development. The Asia-Pacific region dominates the list, accounting for 25 of the 50 cities, and has a combined projects pipeline valued at US$2.1 trillion.
Yasmine Ghozzi, Economist at GlobalData, comments: “Of the 50 ‘Construction Mega Cities’, 29 are considered to be in emerging markets. The rapid growth of cities in the emerging regions reflects both above-average population and per-capita GDP growth. The population of those 29 emerging-region cities will reach an estimated 327 million by 2025, at an annual increase of 1.8% from 237 million in 2007. At the same time, GlobalData projects that the real GDP per capita (measured in real terms) in these emerging urban centers will increase by 2.4% from US$520,854 to US$820,311 between 2007 and 2025.”

Ghozzi adds: “Reflecting the varied levels of economic size, there are major differences among the 50 ‘Construction Mega Cities’ in terms of the value of the project pipelines compared to the size of the economies. Some major cities in the Middle Eastern Gulf states, namely Dubai, Doha and Kuwait City, along with Cairo, secured their spots in the top ten in terms of spending on mega projects relative to the size of their economies. The construction sectors in these cities are expected to be key drivers of economic growth in years to come. However, Dubai’s economy is expected to grow by 1.3% in real terms in 2019 reflecting the completion of many infrastructure projects related to Expo 2020 Dubai.”
Ghozzi continues: “Mumbai has the fastest-growing city economy owing, in part, to the government’s thrust on infrastructure. Supporting continued growth, the Asian Infrastructure Investment Bank (AIIB) announced in November 2019 that it had approved an investment of US$575m in suburban railways and renewable energy sector in Mumbai, taking to its total commitment in India to nearly US$3bn. It will extend a long-term project loan to Mumbai Urban Transport Corporation for US$500m, while the remaining US$75m will be invested in Tata Cleantech Capital to boost renewable energy, power transmission and water infrastructure.”
Related Stories
Codes and Standards | Oct 26, 2017
Boston’s Old South Church asks tower developer for $19 million for casting shade
Request highlights ongoing conflict between developers and residents over right to sunshine.

Codes and Standards | Oct 24, 2017
Asphalt roofing design guide now available in digital form
Recently updated Modified Bitumen Design Guide can be viewed on smartphones and tablets.

Codes and Standards | Oct 23, 2017
Energy efficiency investments on the rise; will increase next year
Survey of facility management executives shows onsite renewables, energy storage will spike in 2018.
Codes and Standards | Oct 20, 2017
AIA contract document updates include new BIM, digital data provisions
Documents are structurally different from 2007, 2008 versions.

Codes and Standards | Oct 19, 2017
IAPMO seeks proposals for 2021 Uniform Plumbing Code, Uniform Mechanical Code
The deadline is March 16, 2018.
Codes and Standards | Oct 18, 2017
States impacted by hurricanes are improving their energy efficiency policies
Florida, Texas, rise in ACEEE state energy efficiency scorecard.

Codes and Standards | Oct 17, 2017
Updated versions of EnergyPlus and OpenStudio building energy modeling tools released
Open-source apps include enhancements for urban-scale modeling.

Codes and Standards | Oct 16, 2017
New, comprehensive insurance exhibit released in AIA 2017 contract document updates
Will allow AIA to make updates more frequently as insurance market changes.

Codes and Standards | Oct 12, 2017
New AIA contract document designates responsibilities for sustainable projects
Roles of architects, contractors outlined in E204–2017.

Codes and Standards | Oct 11, 2017
Data, transparency are keys to next steps in green building, says USGBC chief
Monitoring and comparing performance are critical to advancing sustainability goals.


