


Architecture firms continue to report increasing demand for design services in September, according to a new report today from The American Institute of Architects (AIA).
The Architecture Billings Index (ABI) score for September was 56.6, which is up from August’s score of 55.6. Any score above 50 indicates an increase in billings from the prior month. During September, scoring for both the new project inquiries and design contracts moderated slightly, but remained in positive territory, posting scores of 61.8 and 54.7 respectively.
“The ABI scores over the last eight months continue to be among the highest ever seen in the immediate post-recession periods that have been captured throughout the index’s history,” said AIA Chief Economist, Kermit Baker, Hon. AIA, PhD. “However, it’s unlikely that revenue increases at architecture firms can sustain this pace. Given that growth in both new design contracts and project inquiries have moderated in recent months, we expect to see a similar path for the ABI.”
Key ABI highlights for September include:
• Regional averages: Midwest (57.7); South (57.0); West (56.0); Northeast (51.5)
• Sector index breakdown: mixed practice (58.8); commercial/industrial (58.1); multi-family residential (56.1); institutional (53.5)
The regional and sector categories are calculated as a three-month moving average, whereas the national index, design contracts and inquiries are monthly numbers.
Visit AIA’s website for more ABI information.
Related Stories

Market Data | May 1, 2023
AEC firm proposal activity rebounds in the first quarter of 2023: PSMJ report
Proposal activity for architecture, engineering and construction (A/E/C) firms increased significantly in the 1st Quarter of 2023, according to PSMJ’s Quarterly Market Forecast (QMF) survey. The predictive measure of the industry’s health rebounded to a net plus/minus index (NPMI) of 32.8 in the first three months of the year.
Industry Research | Apr 25, 2023
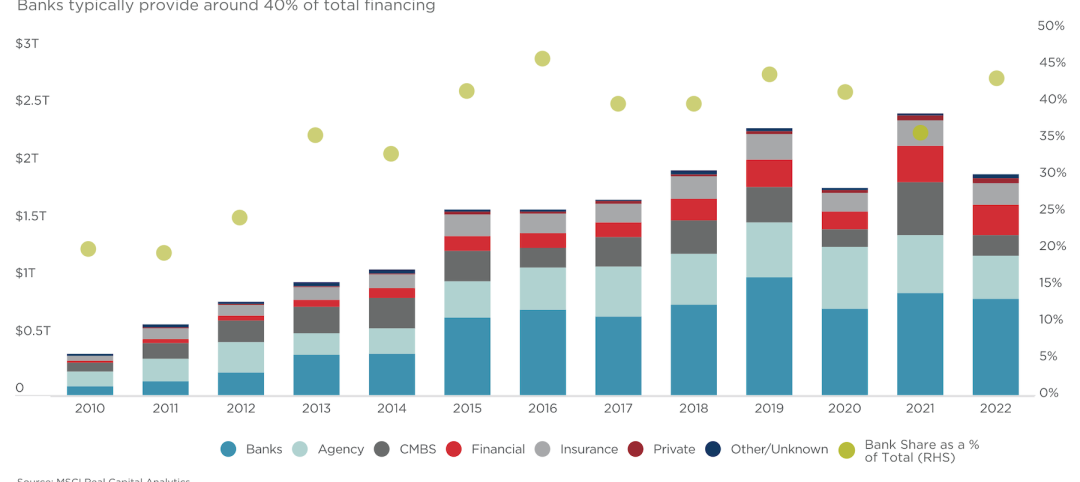
The commercial real estate sector shouldn’t panic (yet) about recent bank failures
A new Cushman & Wakefield report depicts a “well capitalized” banking industry that is responding assertively to isolated weaknesses, but is also tightening its lending.

Architects | Apr 21, 2023
Architecture billings improve slightly in March
Architecture firms reported a modest increase in March billings. This positive news was tempered by a slight decrease in new design contracts according to a new report released today from The American Institute of Architects (AIA). March was the first time since last September in which billings improved.

Contractors | Apr 19, 2023
Rising labor, material prices cost subcontractors $97 billion in unplanned expenses
Subcontractors continue to bear the brunt of rising input costs for materials and labor, according to a survey of nearly 900 commercial construction professionals.

Data Centers | Apr 14, 2023
JLL's data center outlook: Cloud computing, AI driving exponential growth for data center industry
According to JLL’s new Global Data Center Outlook, the mass adoption of cloud computing and artificial intelligence (AI) is driving exponential growth for the data center industry, with hyperscale and edge computing leading investor demand.

Healthcare Facilities | Apr 13, 2023
Healthcare construction costs for 2023
Data from Gordian breaks down the average cost per square foot for a three-story hospital across 10 U.S. cities.

Higher Education | Apr 13, 2023
Higher education construction costs for 2023
Fresh data from Gordian breaks down the average cost per square foot for a two-story college classroom building across 10 U.S. cities.

Market Data | Apr 13, 2023
Construction input prices down year-over-year for first time since August 2020
Construction input prices increased 0.2% in March, according to an Associated Builders and Contractors analysis of U.S. Bureau of Labor Statistics Producer Price Index data released today. Nonresidential construction input prices rose 0.4% for the month.

Market Data | Apr 11, 2023
Construction crane count reaches all-time high in Q1 2023
Toronto, Seattle, Los Angeles, and Denver top the list of U.S/Canadian cities with the greatest number of fixed cranes on construction sites, according to Rider Levett Bucknall's RLB Crane Index for North America for Q1 2023.

Contractors | Apr 11, 2023
The average U.S. contractor has 8.7 months worth of construction work in the pipeline, as of March 2023
Associated Builders and Contractors reported that its Construction Backlog Indicator declined to 8.7 months in March, according to an ABC member survey conducted March 20 to April 3. The reading is 0.4 months higher than in March 2022.


