


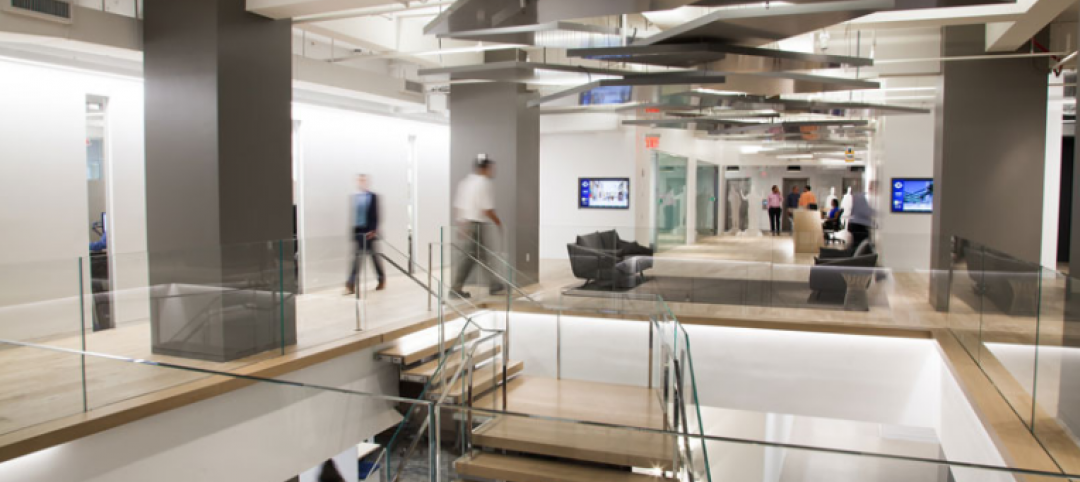
Demand for data centers is “exploding,” says Raj Gupta, PE, LEED AP, CEO of Environmental Systems Design and emeritus member of BD+C’s Editorial Board. According to Gartner Inc., in 2010, 2% of data centers contained 52% of total data center floor space and accounted for 63% of data center hardware spending.
In 2015, 2% of data centers will contain 60% of data center floor space and account for 71% of data center hardware spending.
“Traditional in-house enterprise data centers are under attack,” says Jon Hardcastle, Gartner’s research director. Virtualization technologies are helping companies to utilize their infrastructure more effectively, and data centers are getting more efficient. The move to consolidated third-party data centers is trimming the total number of midsize facilities, while large data centers are benefitting from the rise of cloud computing. +
TOP 25 DATA CENTER SECTOR ARCHITECTURE FIRMS
| Rank | Company | 2011 Data Center Revenue ($) |
| 1 | Corgan Associates | 22,854,000 |
| 2 | Gensler | 20,100,000 |
| 3 | HDR Architecture | 16,000,000 |
| 4 | LEO A DALY | 14,753,871 |
| 5 | PageSoutherlandPage | 12,890,000 |
| 6 | Integrated Design Group | 11,436,000 |
| 7 | Reynolds, Smith and Hills | 4,200,000 |
| 8 | RTKL Associates | 3,840,295 |
| 9 | CTA Architects Engineers | 3,787,800 |
| 10 | EwingCole | 3,000,000 |
| 11 | SMMA|Symmes Maini & McKee Associates | 2,123,426 |
| 12 | HLW International | 1,900,000 |
| 13 | Fentress Architects | 1,456,103 |
| 14 | Kirksey Architecture | 1,379,269 |
| 15 | PGAL | 1,096,000 |
| 16 | Heery International | 808,000 |
| 17 | Fishbeck, Thompson, Carr & Huber | 600,000 |
| 18 | Harley Ellis Devereaux | 600,000 |
| 19 | IBI Group | 563,474 |
| 20 | H+L Architecture | 537,059 |
| 21 | Ware Malcomb | 515,000 |
| 22 | Solomon Cordwell Buenz | 500,000 |
| 23 | HOK | 426,798 |
| 24 | Rule Joy Trammell + Rubio | 350,000 |
| 25 | Gresham, Smith and Partners | 234,347 |
TOP 25 DATA CENTER SECTOR ENGINEERING FIRMS
| Rank | Company | 2011 Data Center Revenue ($) |
| 1 | Fluor Corp. | 212,484,600 |
| 2 | Jacobs | 119,930,000 |
| 3 | Syska Hennessy Group | 43,577,806 |
| 4 | URS Corp. | 34,475,000 |
| 5 | Merrick & Co. | 31,500,000 |
| 6 | AKF Group | 10,500,000 |
| 7 | Atkins North America | 10,035,923 |
| 8 | Parsons Brinckerhoff | 7,400,000 |
| 9 | Eaton Energy Solutions | 6,169,598 |
| 10 | KPFF Consulting Engineers | 5,000,000 |
| 11 | H.F. Lenz Co. | 4,741,000 |
| 12 | Burns & McDonnell | 4,500,000 |
| 13 | Stantec | 4,230,000 |
| 14 | Glumac | 4,196,563 |
| 15 | Science Applications International Corp. | 3,950,000 |
| 16 | Zak Companies | 3,043,228 |
| 17 | Michael Baker Jr., Inc | 2,970,000 |
| 18 | R.G. Vanderweil Engineers | 2,830,900 |
| 19 | RMF Engineering | 2,500,000 |
| 20 | ESD|Environmental Systems Design | 2,450,000 |
| 21 | H&A Architects & Engineers | 2,300,000 |
| 22 | RDK Engineers | 2,245,000 |
| 23 | Guernsey | 2,041,552 |
| 24 | Middough | 1,750,000 |
| 25 | M+W U.S. | 1,654,867 |
TOP 25 DATA CENTER SECTOR CONSTRUCTION FIRMS
| Rank | Company | 2011 Data Center Revenue ($) |
| 1 | Holder Construction | 1,293,000,000 |
| 2 | DPR Construction | 666,292,020 |
| 3 | Turner Corporation, The | 434,435,518 |
| 4 | Whiting-Turner Contracting, The | 393,539,085 |
| 5 | Skanska USA | 369,889,632 |
| 6 | Mortenson Construction | 304,900,000 |
| 7 | Balfour Beatty US | 277,879,080 |
| 8 | Structure Tone | 259,250,000 |
| 9 | Jacobs | 119,930,000 |
| 10 | Gilbane Building | 104,166,000 |
| 11 | JE Dunn Construction | 89,426,706 |
| 12 | Weitz Co., The | 71,442,860 |
| 13 | James G. Davis Construction | 60,000,000 |
| 14 | Hensel Phelps Construction | 50,360,000 |
| 15 | Messer Construction | 49,404,845 |
| 16 | Hoffman Corp. | 46,541,098 |
| 17 | Manhattan Construction Group | 44,196,000 |
| 18 | Brasfield & Gorrie | 34,612,782 |
| 19 | URS Corp. | 34,475,000 |
| 20 | Sundt Construction | 28,801,944 |
| 21 | Kitchell | 24,310,000 |
| 22 | Ryan Companies US | 23,664,942 |
| 23 | Harkins Builders | 21,000,000 |
| 24 | McShane Companies, The | 20,000,000 |
| 25 | Yates Companies., The | 20,000,000 |
Related Stories

Multifamily Housing | Aug 24, 2017
Storage units, lounges most popular indoor and outdoor amenities in multifamily developments
Tenants and condo owners crave extra space for their stuff. Most developers are happy to oblige.
Green | Aug 24, 2017
Business case for WELL still developing after first generation office fitouts completed
The costs ranged from 50 cents to $4 per sf, according to a ULI report.

Healthcare Facilities | Aug 24, 2017
7 design elements for creating timeless pediatric health environments
A recently published report by Shepley Bulfinch presents pediatric healthcare environments as “incubators for hospital design innovation.”
BD+C University Course | Aug 23, 2017
AIA course: New steel systems add strength and beauty
Advances in R&D are fostering new forms of structural and aesthetic steel.

Market Data | Aug 23, 2017
Architecture Billings Index growth moderates
“The July figures show the continuation of healthy trends in the construction sector of our economy,” said AIA Chief Economist, Kermit Baker.

Architects | Aug 21, 2017
AIA: Architectural salaries exceed gains in the broader economy
AIA’s latest compensation report finds average compensation for staff positions up 2.8% from early 2015.

Sports and Recreational Facilities | Aug 18, 2017
Video: Designing the ideal rugby stadium
HOK invited four world-class rugby players into its London studio to discuss what they would like to see in the rugby stadiums of the future.

Architects | Aug 16, 2017
Staffelbach joins DLR Group
The firm will be merging operations immediately with full integration and the name change to DLR Group| Staffelbach effective October 2.

Multifamily Housing | Aug 9, 2017
Related Companies unveils plans for One Hudson Yards luxury rental residences
The 33-story tower will be positioned on the High Line with views of the Hudson River and downtown Manhattan.


